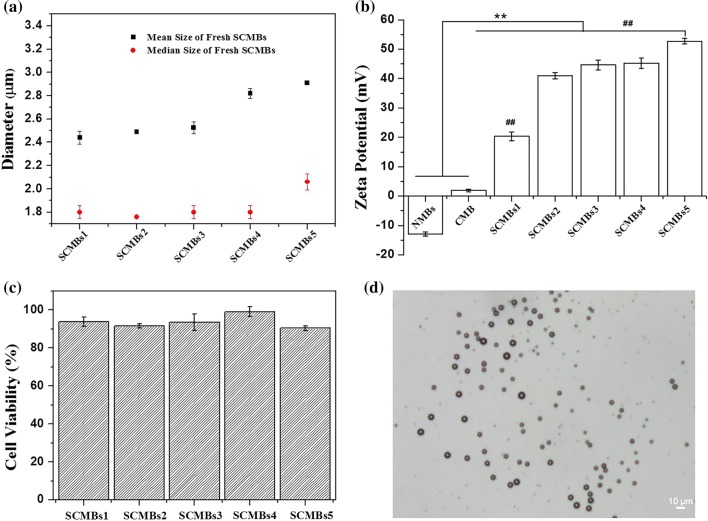
Figure 3.
Characterization of the microbubbles. (a) Mean and median size of SCMBs with varying ratios of the components. (b) Zeta potential of NMBs, CMBs, and series of SCMBs. **p < 0.01 compared with the NMBs and CMB groups, #p < 0.01 compared with the SCMBs 2–4 group, ##p < 0.01 compared with the SCMBs2-5 group. (c) Cell cytotoxicity assay of the SCMBs. Cell viability was measured using the CCK-8 assay after 24 h. (d) Bright-field images of SCMBs4. All microbubbles were washed with water. Scale bar: 10 μm.

