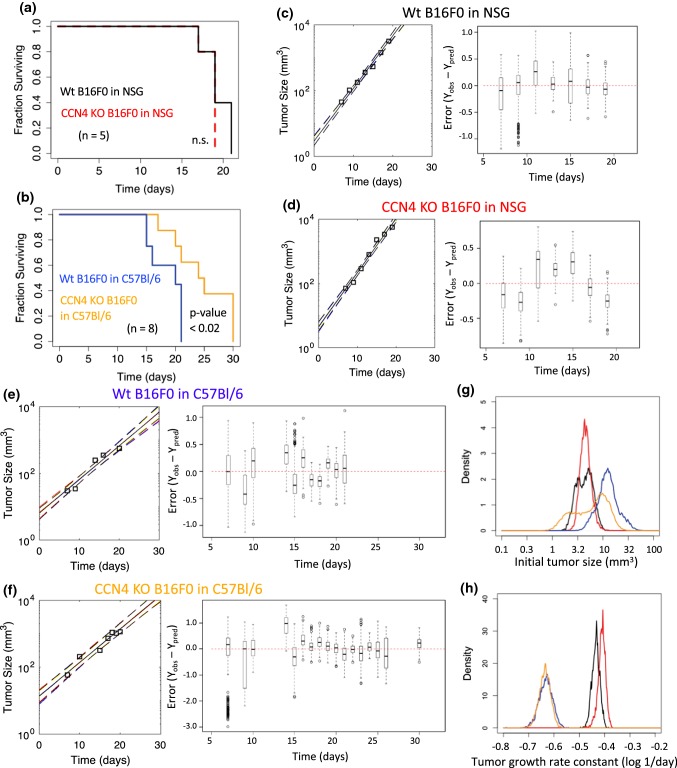
Figure 7.
Ccn4 knockout in B16 cells exhibits different effect on tumor growth in NSG and C57BL/6ncrl mice. Ten NSG mice and sixteen C57BL/6ncrl mice were used in two sets of tumor growth assays (half for B16F0 and half for B16F0-KO cells). Melanoma cells were subcutaneously injected into mice and tumor sizes were recorded from day 7 post-injection until the last day. Kaplan–Meier survival plots of (a) the two groups of NSG mice with B16F0 or B16F0-KO cells (n = 5 in each group) and of (b) the two groups of C57BL/6ncrl mice with B16F0 or B16F0-KO cells (n = 8 in each group). (c–f) Modeling the growth of individual tumors for all four groups of mice. Left panels show measurements of tumor growth of one representative mouse (squares) compared to the posterior distribution in the model predictions (solid line corresponds to maximum in the distribution while dotted lines enclose 95% of the distribution). Right panels show box and whisker plots of the distribution in error (Yobs − Ypred) of the model fits to all of the animals within a cohort. (g, h) Comparison of the posterior distributions in the tumor initiation size (To, (g)) and growth rate constant (kp, (h)) for all four groups of mice [B16F0 wt in NSG (black) or in C57BL/6 (gold), CCN4 KO B16F0 in NSG (red) or in C57BL/6 (blue)].

