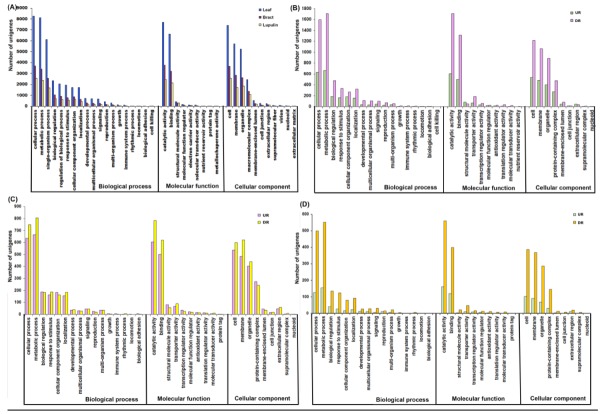
Figure 4.
Comparison of Gene Ontology (GO) classifications of combined and tissues-specific unigenes (A) differentially expressed genes in bract compared to leaf (B), lupulin glands compared to bract (C) and lupulin glands compared to leaf (D). The results are summarized in three main categories: Biological process, Cellular component, and Molecular function. The x-axis indicates subcategories; right y-axis indicates number of genes in a category. UR: up-regulated, DR: down-regulated.

