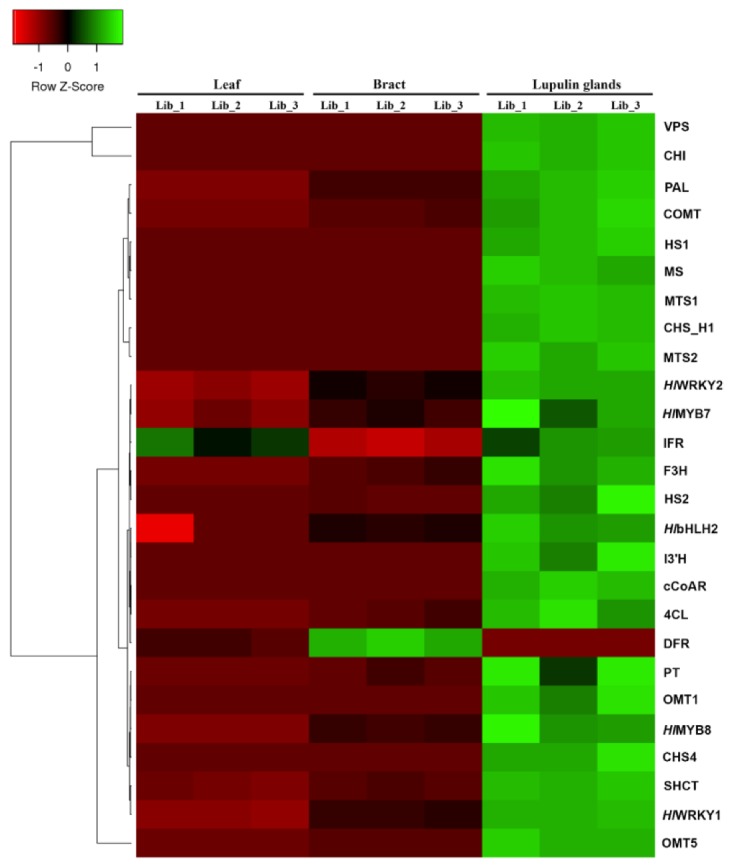
Figure 6.

Heat map and complete linkage hierarchical clustering analysis of relative expression levels of differentially expressed secondary metabolite genes involved in important secondary metabolite biosynthesis. Colors on vertical represent the clustered genes based on gene expression, the horizontal line represents the single gene and color of the line indicates the average gene expression in libraries of leaf, bract, and lupulin glands. The signal ratios were shown in a black-green color scale, where green indicated high expression level and black indicated low expression level. COMT: caffeic acid 3-o-methyltransferase; 4CL: 4-coumarate:CoA ligase; cCoAR: cinnamoyl-CoA reductase; MTS2: myrcene synthase; HS2: humulone synthase 2; CHI: chalcone isomerase; VPS: valerophenone synthase; CHS_H1: chalcone synthase; PAL: phenylalanine ammonia-lyase; MTS1: monoterpene synthase 1; SHCT: shikimate o-hydroxycinnamoyltransferase; OMT5: O-methyltransferase 5; I3′H: isoflavone 3′-hydroxylase; OMT1: O-methyltransferase 1; MS: myrcene synthase; HS1: humulone synthase 1; CHS4: chalcone synthase 4; F3H: flavonol synthase/flavanone 3-hydroxylase; DFR: dihydroflavonol 4-reductase; IFR: isoflavone reductase-like protein; PT: prenyltransferase. The color scale (−2 to 2) is shown on the left; red represents low content, green represents high content.
