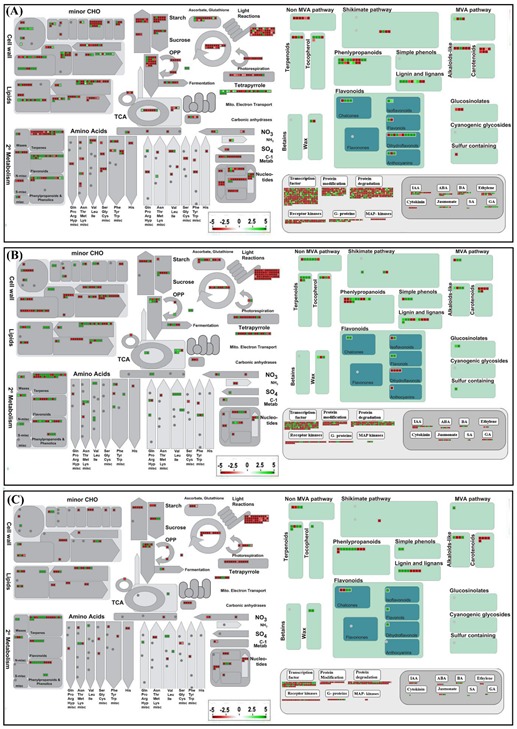
Figure 7.

Overview of the MapMan visualization of differentially expressed genes in three stages. (A) bract compared to leaf, (B) lupulin glands compared to bract, and (C) lupulin glands compared to leaf. The log2 fold changes of significantly differentially expressed genes were imported and visualized in MapMan. Red and green displayed signals represent a decrease and an increase in transcript abundance, respectively in the pairwise comparison sets of the three stages. The scale used for coloration of the signals (log2 ratios) is presented.
