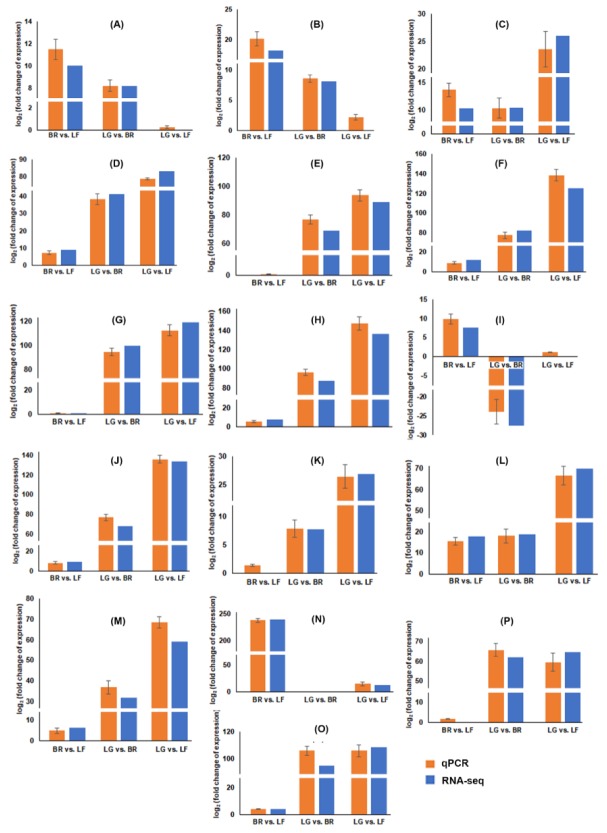
Figure 8.
Validation of expression patterns of differentially expressed genes by RT-qPCR. Graph showing fold change of the structural genes, regulatory genes and two randomly selected genes in the pairwise comparison sets of the three stages, namely, bract compared to leaf (BR vs. LF), lupulin glands compared to bract (LG vs. BR) and lupulin glands compared to leaf (LG vs. LF). (A) PAL: phenylalanine ammonia lyase; (B) 4CL: coumarate coenzyme A ligase; (C) C4H: cinnamate 4-hydroxylase; (D) CHS_H1: chalcone synthase isoform 1; (E) OMT1: O-methyltransferases isoform 1; (F) PT1: prenyltransferase 1; (G) VPS: valerophenone synthase; (H) CHS4: chalcone synthase isoform 4; (I) DFR: dihydroflavanol reductase; (J) CHI: chalcone isomerase; (K) bHLH2 transcription factor; (L) HlWRKY1 transcription factor; (M) HlMYB8 transcription factor; (N) ERT: ethylene-responsive transcription factor ERF017; (O) SHCT: shikimate o-hydroxycinnamoyltransferase; (P) HlMYB8 transcription factor. qRT-PCR analyses were normalized using DEAD-box ATPase-RNA-helicase (DRH) as an internal control gene. The fold change of each gene was calculated by the 2−ΔΔCT method. Data were means ± standard deviations (SD) of three biological replicates.

