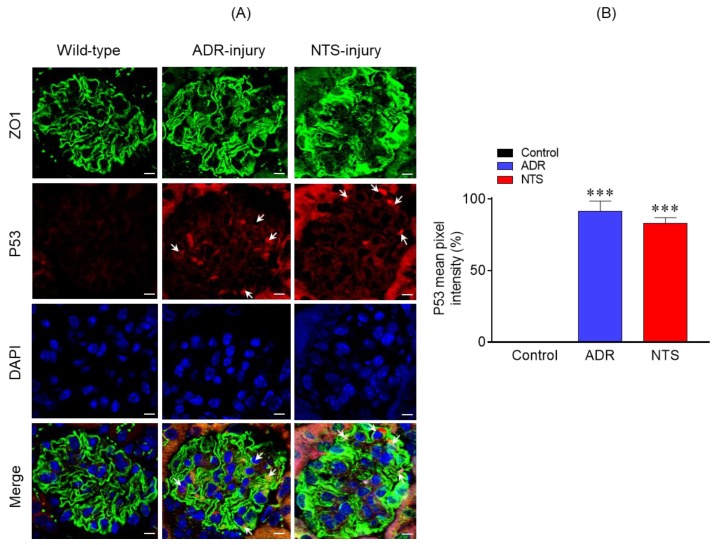
Figure 4.
(A) Immunostaining analysis of kidney sections using P53 (red) and Zonula Occludens 1 (ZO1) (green) antibodies and DAPI (blue) showed increased P53 staining in the ADR- and nephrotoxic serum (NTS)-injured mice. Scale bar = 10 µm. (B) Quantitative analysis of mean pixel intensity showed increased P53 expression in the glomeruli of ADR- and NTS-injured mice compared to the control. A total of 30–40 glomeruli from three mice representing each group were used for statistical analyses. Data are presented as mean ± SEM; two-tailed t-test; *** p ≤ 0.001 ADR vs. control and NTS vs. control.

