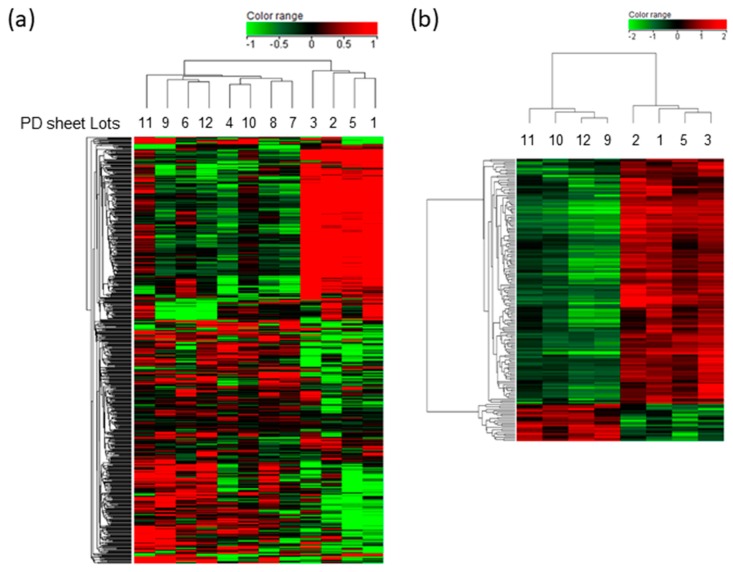
Figure 2.
Heat map and hierarchical clustering of efficacy-correlated gene expressions: PD sheets exhibited a distinct gene expression profile according to their in vivo efficacy. Red indicates high expression levels, and green represents low expression levels. (a) Analyzed using efficacy correlated 443 gene set. (b) Differentially expressed 171 genes in effective and less effective lots of PD sheets.

