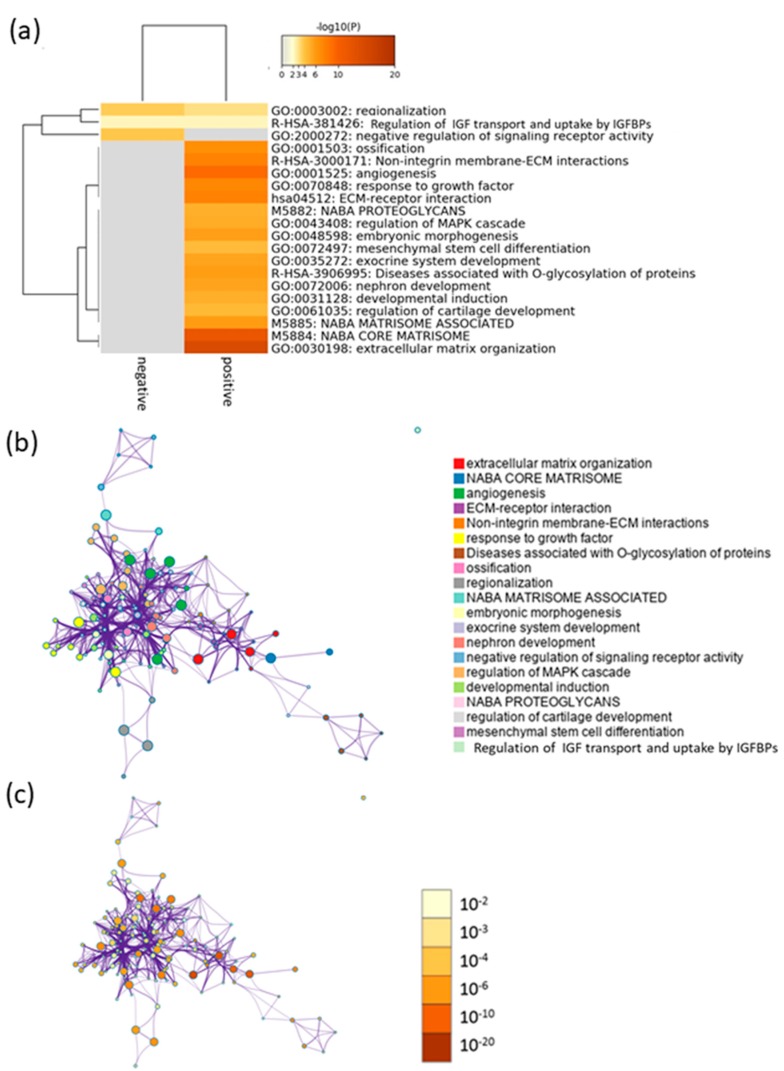
Figure 3.
Meta-enrichment analysis of the efficacy-associated genes: (a) Heat map of the top 20 enriched clusters based on positive and negative correlation gene lists. Colors represent statistical significance, with gray indicating a lack of significance. ECM: extracellular matrix, IGF: insulin-like growth factor, IGFBPs: insulin-like growth factor binding proteins. (b) Enrichment network visualization: Cluster annotations are shown color-coded. The size of the node indicates the number of genes included in the ontology terms or pathways. (c) The color scale for statistical significance was applied to the same cluster network.

