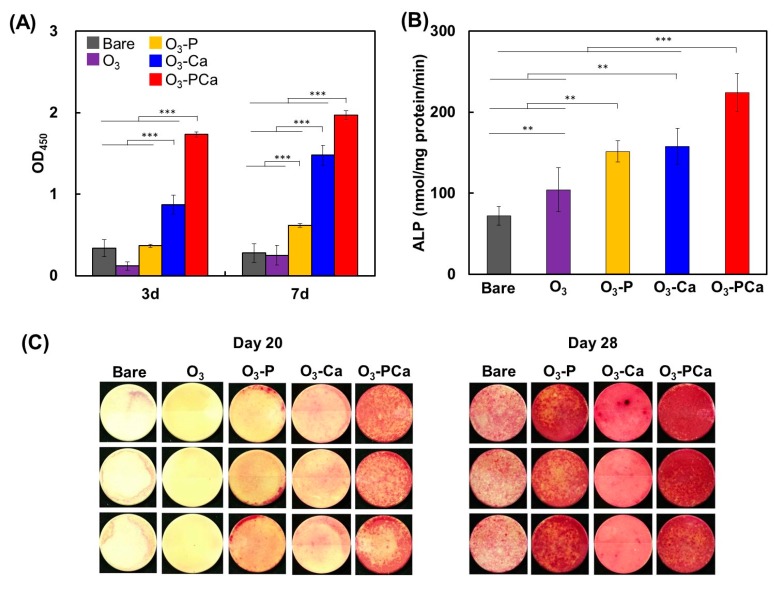
Figure 5.
Mesenchymal stem cell responses to samples. (A) Cell proliferation (n = 4), (B) ALP activity at 14 days (n = 4), (C) bone-like nodule formation at 20 and 28 days (n = 3). Data are the mean ± standard derivation (** p < 0.01, *** p < 0.001). Bare: untreated PEEK, O3: ozone-gas-treated PEEK, O3-P: phosphate-immobilized PEEK, O3-Ca: calcium-immobilized PEEK, O3-PCa: phosphate and calcium co-immobilized PEEK.

