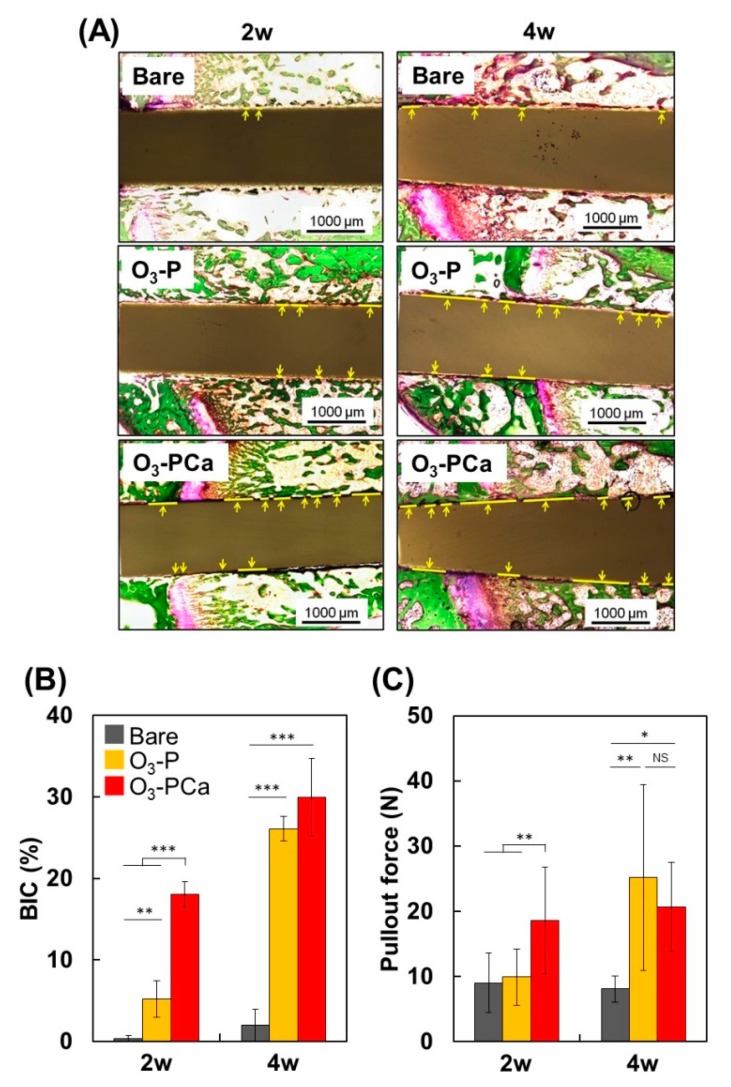
Figure 6.
Osseointegration capability of samples in a rat femur implantation model. (A) Histological images of new bone formation and osseointegration at two- and four weeks post-implantation. Sections were stained by the Villanueva-Goldner stain. Yellow lines indicate bone tissue directly in contact with implants. Scale bars are 1000 μm. (B) Bone-to-implant contact ratio (BIC) (n = 3), and (C) bond strength between bone and implant (pullout force) (n = 6). Data are mean ± standard derivation (* p < 0.05, ** p < 0.01, *** p < 0.001, NS: not significant). Bare: untreated PEEK, O3-P: phosphate-immobilized PEEK, O3-PCa: phosphate and calcium co-immobilized PEEK.

