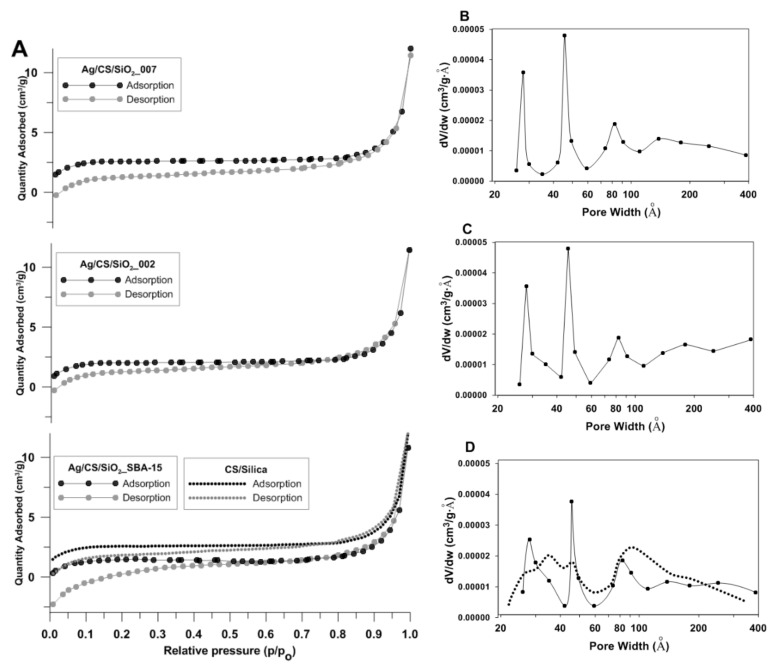
Figure 5.
(A) Nitrogen adsorption-desorption isotherms plots of Ag/CS/silica nanofiber composites at 77 K. (B–D) Porosity distributions by the Barrett–Joyner–Halenda (BJH) model were calculated from the adsorption branch of the isotherms. Note: Dotted lines refer to a CS/silica sample used as a reference.

