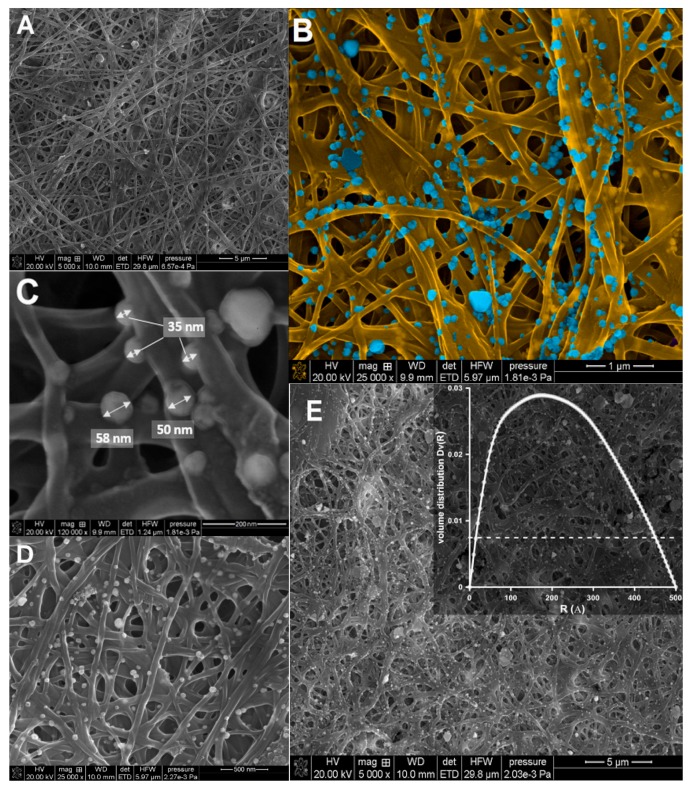
Figure 7.
Representative SEM images of the electrospun nanofibers. (A) SEM image of CS/silica (CS/SBA-15), (B–E) SEM images of Ag/CS/SBA-15 at various magnifications. Note: The insert in Figure 4E shows the radial distribution function, Dv(R), obtained from the SAXS data for Ag/CS/SBA-15.

