Figure 1.
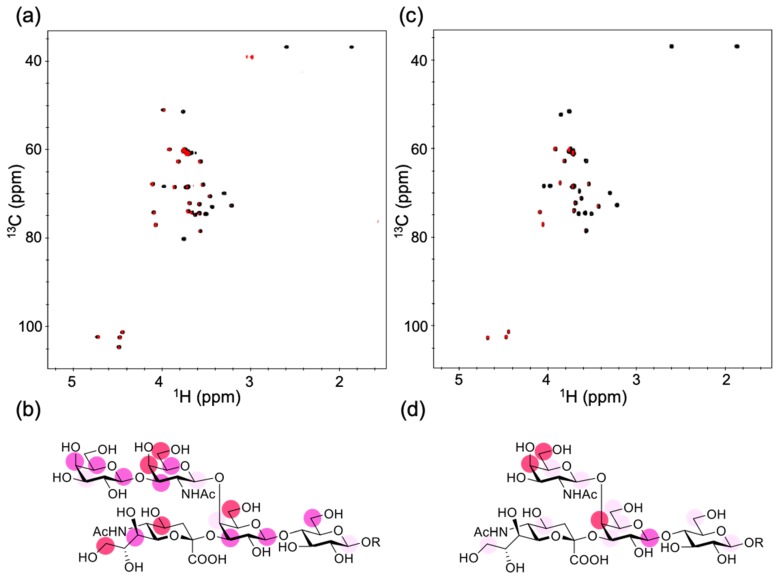
NMR observation of the interaction of gangliosidic oligosaccharides with GB2. (a) Overlay of the 2D 1H–13C heteronuclear single-quantum correlation (HSQC) spectrum (black) and the 1H–13C saturation transfer difference (STD)-HSQC spectrum (red) of the 2-trimethylsilylethyl derivatives of the GM1 pentasaccharide (10 equiv.) with 50 μM GB2. (b) Mapping of the binding epitope of the GM1 pentasaccharide. (c) Overlay of the 2D 1H–13C HSQC spectrum (black) and the 1H–13C STD-HSQC spectrum (red) of the 2-trimethylsilylethyl derivatives of the GM2 tetrasaccharide (10 equiv.) with 50 μM GB2. (d) Mapping of the binding epitope of the GM2 tetrasaccharide. In (b,d), the maximum peak intensity of each oligosaccharide was taken as 100%, and the relative intensities (over 80% red, over 65% pink, over 50% light pink) are indicated. R represents a 2-trimethylsilylethyl group.

