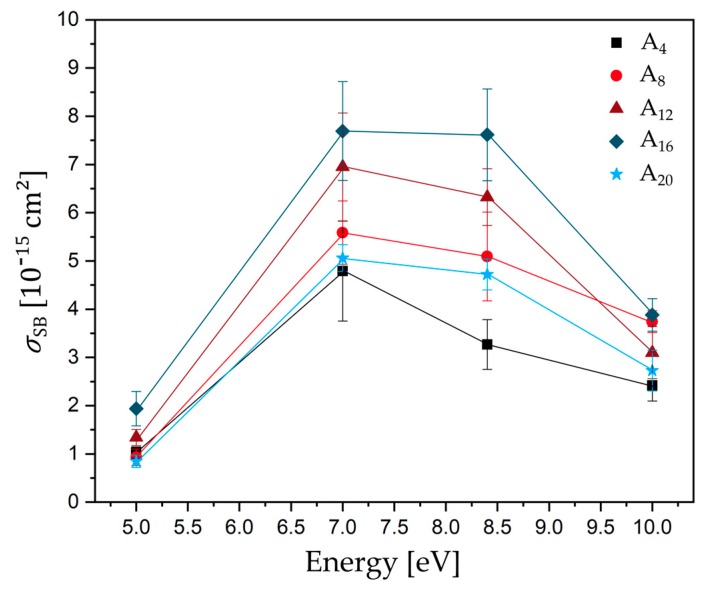
Figure 3.
Plot of absolute DNA strand break cross section for different single stranded DNA sequences (d(A4) black-square, d(A8) light red-circle, d(A12) dark red-triangle, d(A16) dark blue-diamond, and d(A20) light blue-star) as a function of the electron energy. Solid lines connect the data points to guide the eye.

