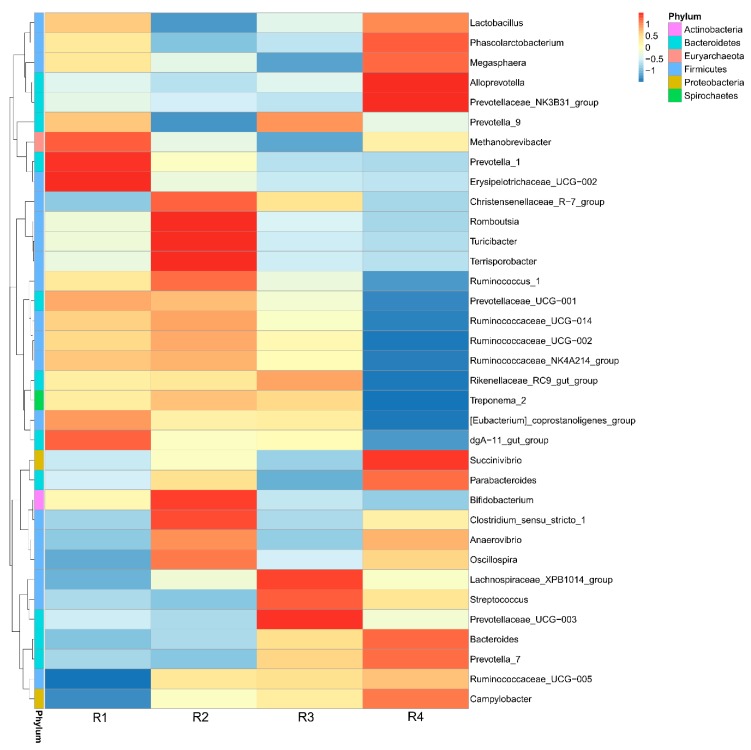
Figure 4.
Heat map of the relative abundance of genera in sow feces on day 110 of pregnancy. Each vertical lane corresponds to one treatment. Different colors indicate the relative abundance of genera. R1, R2, R3, and R4 were diets in which the ratios of insoluble to soluble fiber were 3.89, 5.59, 9.12, and 12.81, respectively. n = 6 for all treatments.

