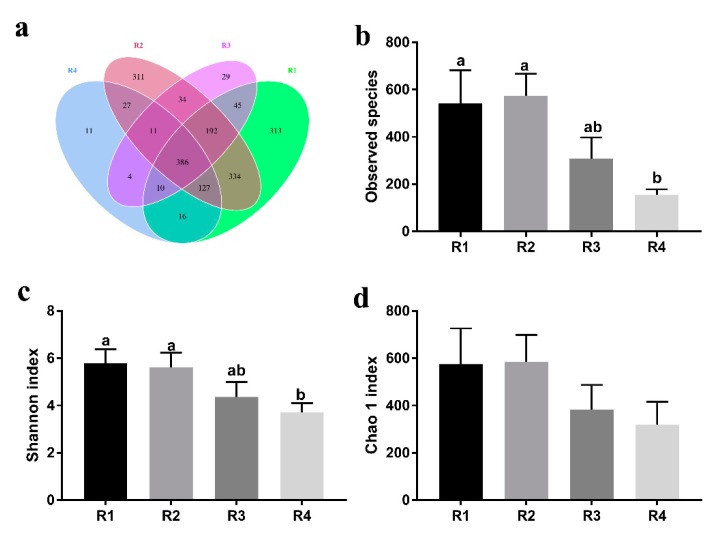
Figure 5.
Comparison of the OTUs and alpha diversity analyses of piglet fecal microbiota among treatments. The observed OTUs share ≥97% sequence similarity. (a) A Venn diagram was generated to describe the common and unique OTUs among all treatments. (b) The observed species, (c) Shannon index, and (d) Chao 1 index were used to ascertain differences in alpha diversity according to different diets. Individual piglets were regarded as the experimental units (n = 6 per treatment). R1, R2, R3, and R4 were diets in which the ratios of insoluble to soluble fiber were 3.89, 5.59, 9.12, and 12.81, respectively. Values are mean ± standard error (n = 6). a–b Means with different superscripts within a row differ (p < 0.05).

