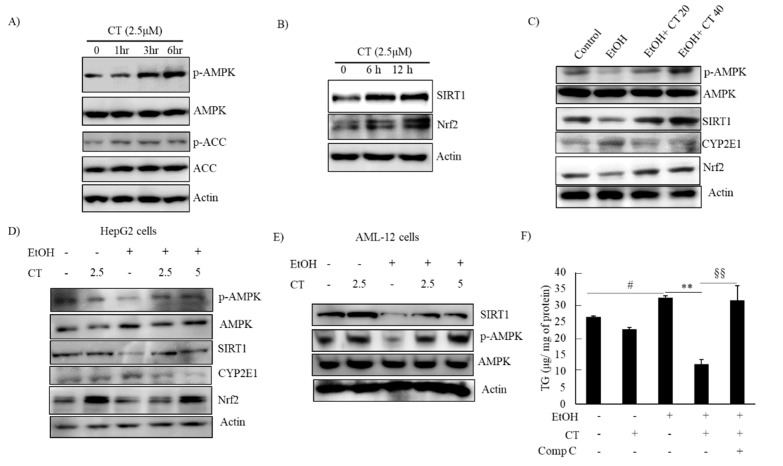
Figure 5.
CT activated AMPK/SIRT1 signaling. (A,B) HepG2 cells were treated with 2.5 μM CT for indicated times. Western blot analysis of phosphorylated AMPK, ACC, SIRT1, and Nrf2. (C) C57BL/6 mice were pair-fed either control or ethanol-containing diet with or without CT (20 or 40 mg/kg) for four weeks. Western blot analysis of phosphorylated AMPK, SIRT1. CYP2E1, and Nrf2. (D) HepG2 cells were incubated with 50 mM ethanol and treated with CT (2.5 or 5 μM) for 24 h. Western blot analysis of phosphorylated AMPK, SIRT1, CYP2E1, and Nrf2. (E) AML-12 cells were incubated with 50 mM ethanol and treated with CT (2.5 or 5 μM) for 24 h. Western blot analysis of phosphorylated AMPK and SIRT1. The images are representative (F) HepG2 cells were pretreated with CT (2.5 μM) for 3 h or with compound C (comp C) (10 μM) for 6 h, followed by ethanol (100 μM) treatment. Measurement of intracellular TG levels. Data are shown as mean ± SD of three independent experiments. # p < 0.05 vs. untreated control, ** p < 0.01 vs. ethanol-treated group. §§ p < 0.01 vs. ethanol and CT-treated group. Densitometric analysis of western blots are given in Supplementary Figures S2 and S3A–G.

