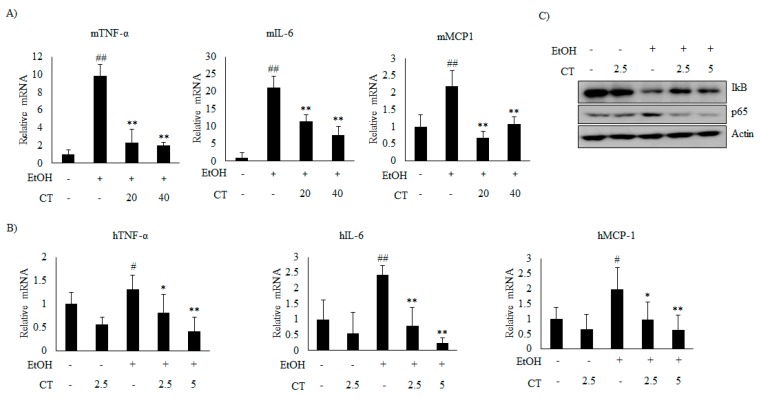
Figure 8.
CT inhibited inflammation induced by ethanol in chronic ethanol-fed mice and HepG2 cells. (A) qPCR analysis of mTNF-α, mIL-6, and mMCP-1. Data are shown as mean ± SD (n = 6). ## p < 0.01 vs. pair-fed control mice, * p < 0.05, ** p < 0.01 vs. ethanol-fed mice. (B) qPCR analysis of hTNF-α, hIL-6, and hMCP-1. Data are expressed as mean ± SD from three independent experiments. # p < 0.05, ## p < 0.01 vs. untreated control, * p < 0.05, ** p < 0.01 vs. ethanol-treated group. (C) HepG2 cells were incubated with 50 mM ethanol and treated with CT (2.5 or 5 μM) for 24 h. Western blot analysis of IκB and NF-κB p65. Densitometric analysis of western blots is given in Supplementary Figure S5.

