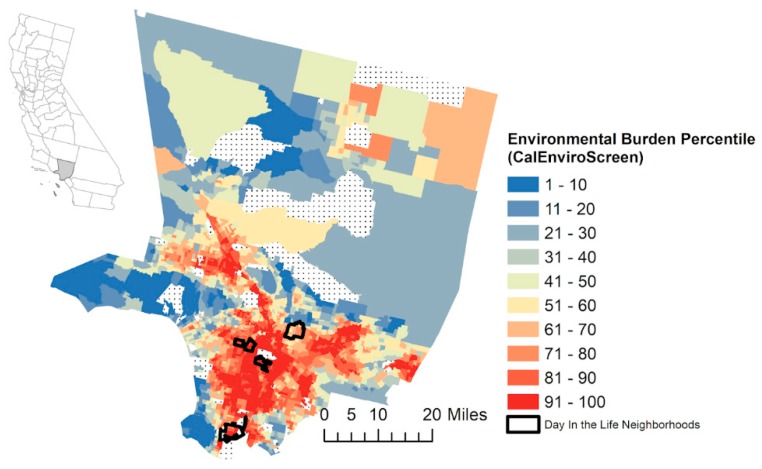
Figure 1.
Neighborhoods of youth participants in the A Day in the Life program in Los Angeles County. Shown with the percentiles for environmental pollution and community vulnerabilities by census tract as measured by the CalEnviroScreen 3.0 tool from the state of California [48]. Percentiles are calculated based on exposure indicators (air quality, diesel particulate matter, drinking water contaminants, pesticide use, and toxic releases from facilities and traffic density), environmental effect indicators (cleanup sites, groundwater threats, hazardous waste generators and facilities, impaired water bodies, and solid waste sites and facilities), sensitive population indicators (asthma, cardiovascular disease, and low birth weight infants), and socioeconomic factor indicators (educational attainment, housing burden, linguistic isolation, poverty, and unemployment).

