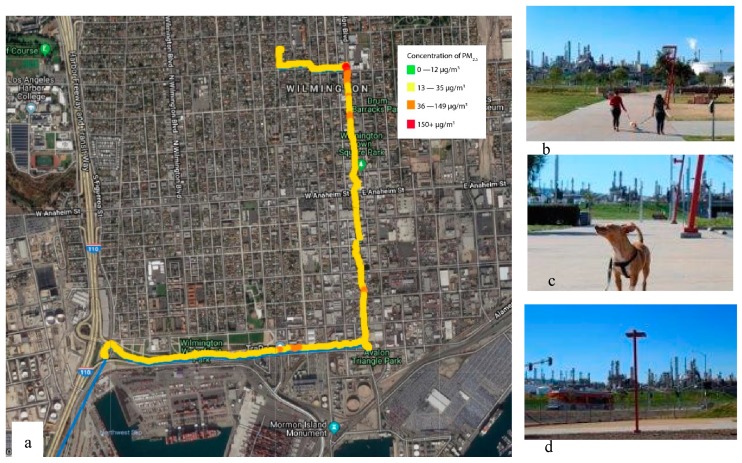
Figure 4.
An example of the combination of images (all taken by the participant) with sensor data. (a) Map of youth air monitoring route recorded with AirBeam on AirCasting app. (b) A park adjacent to an oil refinery complex in Wilmington, CA. (c) The participants dog walking at the park. (d) A view of the industrial complex from the park. The participant describes the following: “I took part in a program with University of Southern California to help track the air quality in my community. After walking around Wilmington and San Pedro with an air monitor, I was surprised with the results. On the map shown, you are able to see one of my routes to school. The yellow and orange indicate the higher levels of fine particulate matter in the air. This was shocking to see. I decided to focus my images on the pollution happening around our parks. These are only two parks that are near my home, where the refineries are visible, and you can see the particulate matter in the air. Many babies, kids, adults, and even animals breathe in this pollution that causes serious damage to one’s health. That is why I am in CBE [Communities for a Better Environment], to make a difference in my community and to stop this from getting any worse.”

