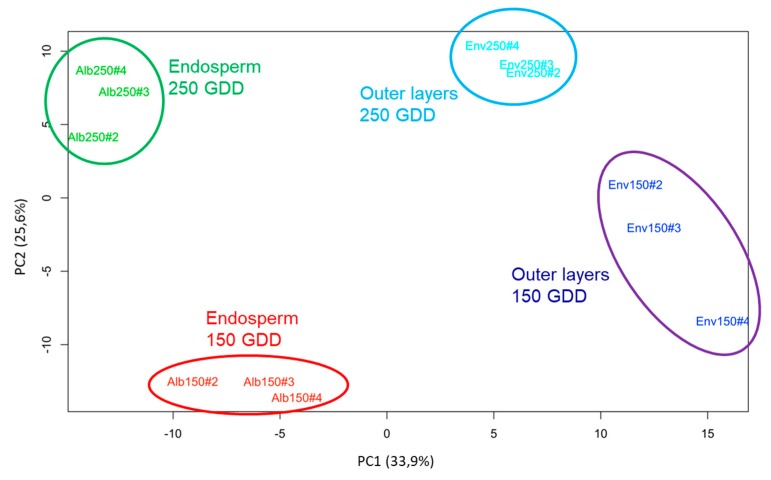
Figure 2.
Principal component analysis (PCA) performed using the relative amounts of cell wall proteins (CWPs) for both parts of the wheat grain and at the two developmental stages (150 and 250 GDD). Individual maps of the biological replicates (red: endosperm samples at 150 GDD, green: endosperm samples at 250 GDD, dark blue: outer layers samples at 150 GDD, light blue: endosperm samples at 250 GDD) along principal components 1 and 2.

