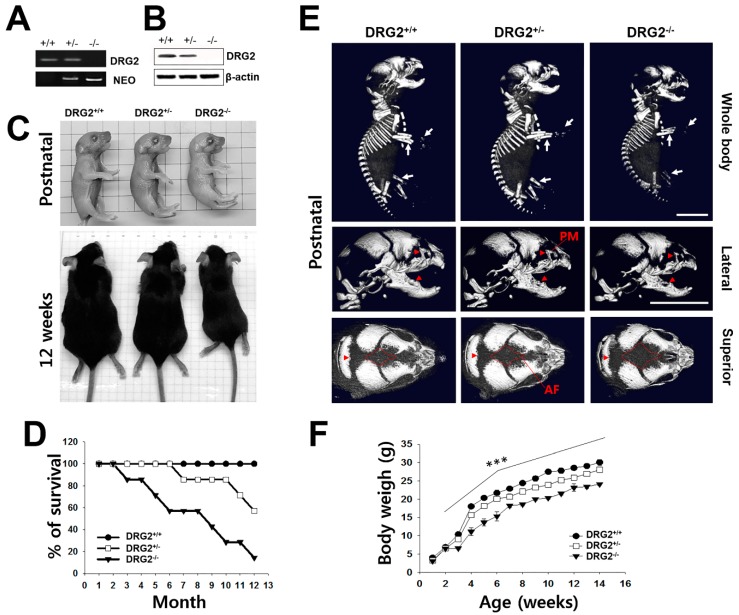
Figure 1.
Multiple phenotypic characterization of DRG2 knock out (KO) mice. (A,B) Confirmation of DRG2 deficiency. Expression levels of DRG2 in the cerebral cortex was determined by (A) RT-PCR and (B) western blot analysis. NEO, the primer set of PGK-neo cassette targeting vector for the DRG2 KO mice. (C) Comparison of body size of DRG2−/− mice with DRG2+/+, and DRG2+/− littermates at postnatal day 1 (top) and 12 weeks (bottom). (D) Survival curve for DRG2+/+, DRG2+/−, and DRG2−/− mice. n = 12 per each group. (E) Micro-CT scan images of DRG2+/+, DRG2+/−, and DRG2−/− at postnatal day 1. Top, whole body; middle, lateral views of mice skulls; bottom, superior views of mice skulls. Arrowheads indicate reduced mineralization and arrows show reduction in the radius and ulna of the forelimb and hindlimb in DRG2−/− mice. DRG2−/− mice showed increased anterior fontanel (AF) and reduced premaxillary-maxillary (PM). Scale bar, 500 μm. (F) Body weight of DRG2+/+, DRG2+/−, and DRG2−/− mice. n = 12 per each group. One-way ANOVA: *** p < 0.001. Error bars indicate SEM.

