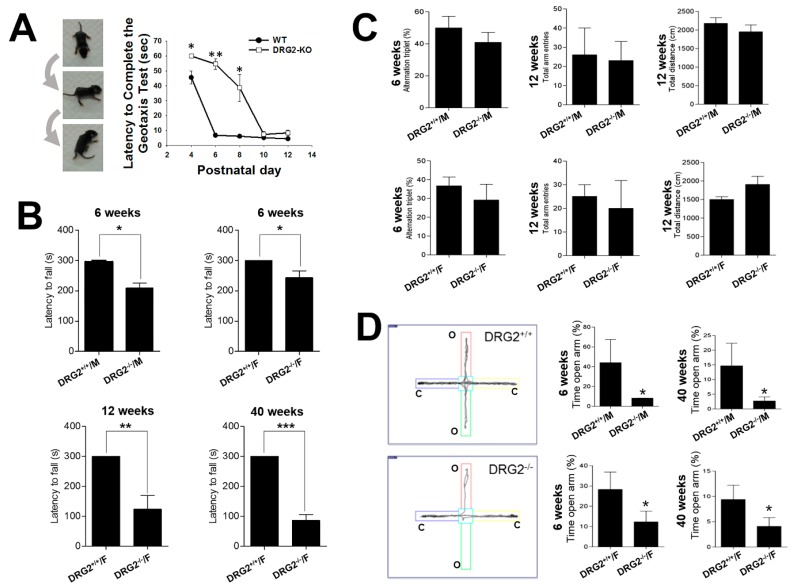
Figure 4.
Behavioral impairments in DRG2 deficient mice. (A) Geotaxis test. (Left) series of photographs illustrating a mouse performing the geotaxis test. (Right) Graphs based on the latency to complete the geotaxis test in seconds (mean ± SEM, maximum 60 s, n = 8 per each group). * p < 0.05, ** p < 0.005. (B) Rotarod test. DRG2+/+ and DRG2−/− and mice were compared at six, 12, and 40 weeks of age. At six weeks, both female and male mice were compared. At 12 and 40 weeks, female mice were compared. Data represent latency to fall (means ± SEM, maximum 300 s, n = 8 per each group). * p < 0.05, ** p < 0.005, *** p < 0.001. Student’s t-test. (C) Y-maze test. Both female and male of DRG2+/+ and DRG2−/− mice were compared at six and 12 weeks of age. (Left) Percentage of alternation triplet; middle, total number of arm entries; (right) total distance. Data represent means ± SEM (n = 8 each group). (D) Elevated plus maze test. Both female and male of DRG2+/+ and DRG2−/− mice were compared at 6 and 40 weeks of age. Left, representative images showing typical examples of DRG2+/+ and DRG2−/− mice exploring in the elevated plus maze apparatus. (Middle and right), graphs based on the percentage of time spent in the open arms. Data represent means ± SEM (n = 8 per each group). * p < 0.05.

