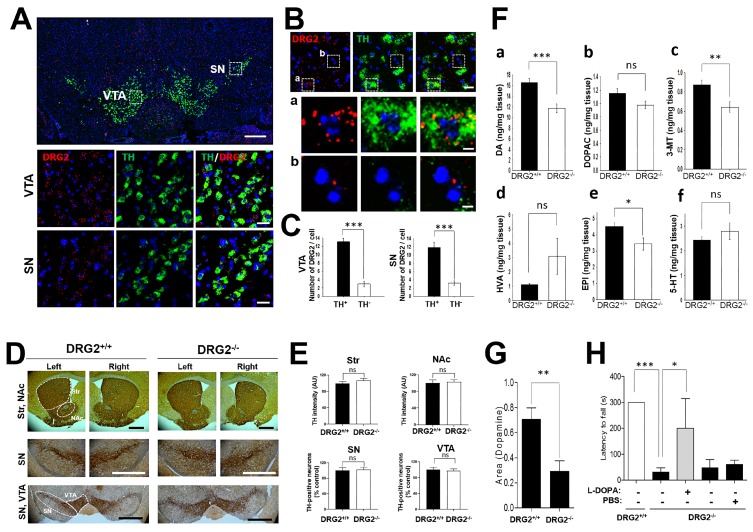
Figure 5.
DRG2 deficient mice show decreased release of nigrostriatal dopamine. (A) In situ hybridization analysis of DRG2 and tyrosine hydroxylase (TH) expression in mouse mid brain. Coronal sections of adult mouse brain were hybridized with antisense probes against DRG2 (red) and TH (green). Nuclei were stained with DAPI. (Top) representative images for DRG2 and TH. Scale bar, 500 μm. (Middle and bottom) The boxed regions in the ventral tegmental area (VTA) and substantia nigra (SN) of the top panel were viewed at higher magnification in the middle and bottom panels, respectively. Scale bars, 20 μm. (B) Expression of DRG2 in TH-positive and -negative cells in the VTA region. (Top) In situ hybridization analysis of DRG2 and TH expression in the mouse VTA region. Scale bars, 20 μm. (Middle and bottom) The boxed regions in (a) TH-positive and (b) TH-negative cells of the top panel were viewed at higher magnification in the (a) middle and (b) bottom panels, respectively. Scale bars, 5 μm. (C) Numbers of DRG2 mRNA dots on the TH-positive or -negative cells in the SN and VTA region of (B) were quantified. Data represent the means ± SEM (n = 8 per each group). *** p < 0.0001. (D) Immunohistochemical staining for the TH neuron in Str, SN, NAc and VTA of 1-year old DRG2+/+ and DRG2−/− mice. The dot area indicates the quantification regions. Scale bars, 500 μm. (E) Quantification of TH neurons in the images of (D). Graphs data represents relative TH staining intensity in the Str and NAc and number of TH positive neuron in the SN and VTA. Values obtained from DRG2+/+ mice were set to 100. Student’s t-test; ns, not significant. (F) HPLC analysis for striatal (a) dopamine, (b) 3,4-dihydroxyphenylacetic (DOPAC), (c) 3-methoxytyramine (3-MT), (d) homovanillic acid (HVA), (e) epinephrine (EPI), and (f) serotonin (5-HT) levels of DRG2+/+ and DRG2−/− mice. Data represent means ± SEM (n = 8 per each group). ** p < 0.005, *** p < 0.001. (G) Fast-scan cyclic voltammetry (FSCV) analysis for dopamine release in the striatal slice. In the coronal brain slices, dopamine release was evoked by a single electrical stimulus pulse, and the extracellular dopamine concentration in the striatum was measured using FSCV. Data represent the area under the dopamine concentration curve (means ± SEM, n = 3 per each group). ** p < 0.001. (H) Effect of L-DOPA administration on the motor behavior of DRG2−/− mice. DRG2−/− mice were i.p. injected with L-DOPA (50 mg/kg) and tested on a rotating rod. Data represent the latency time to fall in the rotarod test (means ± SEM, maximum 300 s, n = 6 per each group). * p < 0.05, *** p < 0.001.

