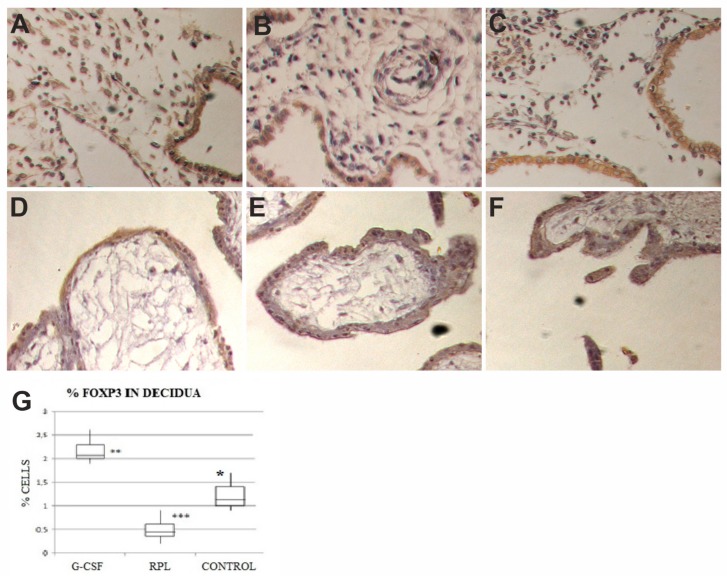
Figure 1.
In decidua of Granulocyte Colony Stimulating Factor (G-CSF) treated samples (A), in the stroma there was a remarkable increase in the number of Foxp3 cells with respect to other two groups, epithelial cells showed a moderate staining (brown color) (400×). In decidua of no treated Recurrent Pregnancy Loss (RPL) samples (B), in the stroma there was a strong reduction in the number of Foxp3 cells, epithelial cells showed a moderate staining (brown color) (400×). In decidua of control samples (C), in the stroma there was a number of cells positive to Foxp3 cells, higher than in no-treated RPL and lower than in G-CSF treated samples, epithelial cells showed a moderate staining (brown color) (400×). The graph (G) showed percent of immunohistochemical positive cells in the stroma to Foxp3 (charts display median and quartiles with whiskers showing the range): There was a statistically significant difference between G-CSF vs. RPL (* p < 0.001), G-CSF vs. Control (** p < 0.01) and RPL vs. Control (*** p < 0.01). Foxp3 expression in decidua and trophoblast of first trimester pregnancy. In trophoblast of GCS-F treated group (D), no treated RPL (E) and Control (F) there was no staining at all for Foxp3 (400×).

