Figure 3.
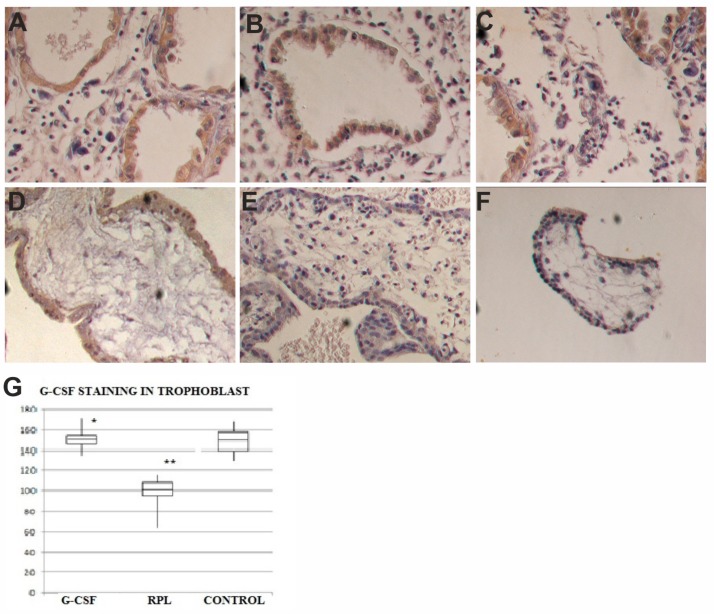
G-CSFR expression in decidua and trophoblast of first trimester pregnancy. In decidua of G-CSF treated group (A), in the no treated RPL group (B) and Control pregnancies (C) there was the same staining levels in the epithelial cells but no in the stroma for G-CSFR (brown color) (400×). In trophoblast of G-CSF treated samples (D), the syncytiotrophoblast was moderately positive to G-CSFR (brown colour) (400×). In trophoblast of RPL no-treated samples (E), the syncytiotrophoblast was strongly positive to G-CSFR, more than in other two groups (400×). In trophoblast of Control samples (F), the syncytiotrophoblast was moderately positive to G-CSFR (brown color) similar to G-CSF treated samples (400×). The graph (G) showed immunohistochemical staining semi quantitative HSCORE for G-CSFR (charts display median and quartiles with whiskers showing the range): There was a statistically significant differences between G-CSF vs. RPL (* p < 0.001) and RPL vs. Control (** p < 0.001).

