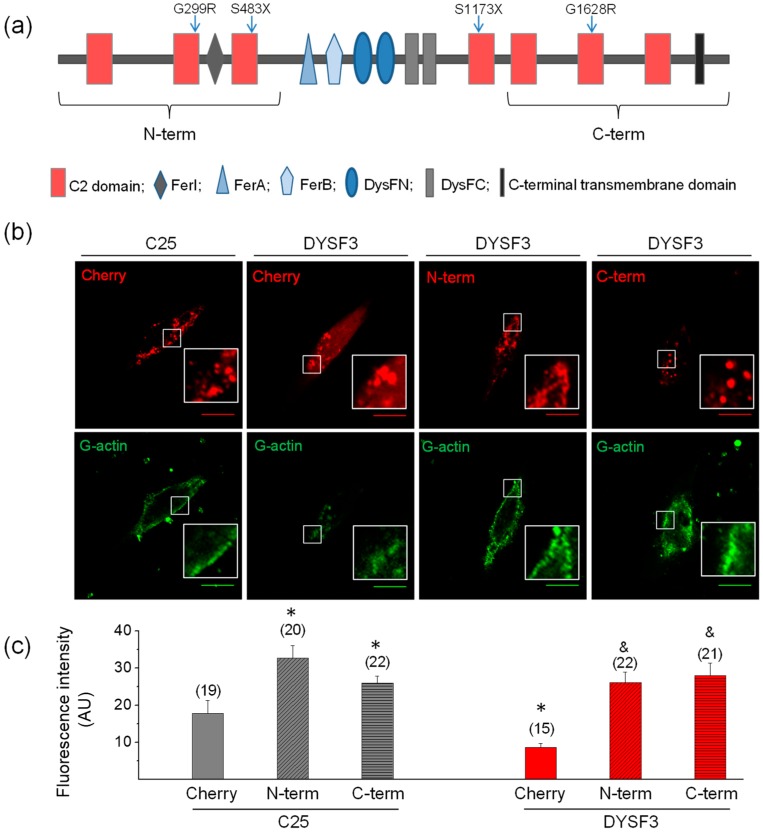
Figure 4.
The N- or C- terminal dysferlin regions are efficient in restoring G-actin incorporation in dysferlinopathy myoblasts. (a) Schematic representation of dysferlin regions included in the N-terminal and C-terminal constructs. Blue arrows indicate positions of dysferlin mutations carried by the cell lines (see Table 1). (b,c) Control C25 or dysferlinopathy DYSF3 myoblasts were transfected with mCherry alone (Cherry), or dysferlin N-terminal (N-term) or C-terminal (C-term) fused to mCherry. Twenty-four hours later, fluorescently tagged G-actin incorporation was assayed as described in Methods, and confocal images were acquired at the equatorial plane of the cells using identical exposure settings between compared samples. (b) Fluorescent actin filaments in C25 or DYSF3 myoblasts expressing Cherry, and DYSF3 myoblasts expressing N-term or C-term. Scale bar = 10 µm. Insets show digital magnification of the boxed areas. (c) Actin fluorescence intensity was measured in a single focal plane and normalized by the cell area. Bars represent means ± SEM. Actin fluorescence intensity was measured in a single focal plane at the equator of cells and normalized by the cell area. The number of analyzed cells from four different cultures is indicated in parentheses. * p < 0.05 compared with C25 myoblasts expressing mCherry, & p < 0.05 compared with DYSF3 expressing mCherry (t-test).

