Figure 6.
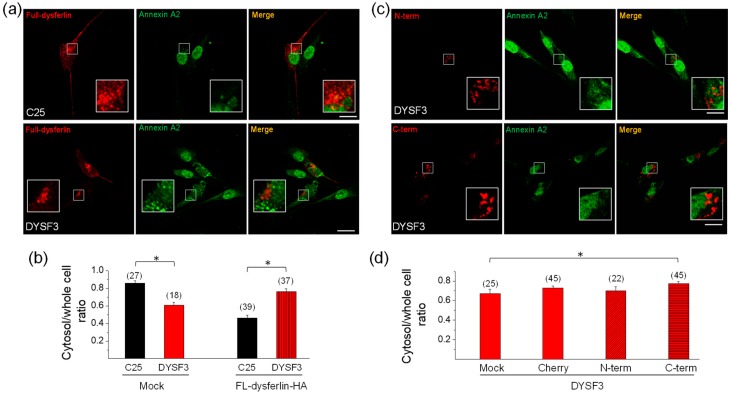
Annexin A2 distribution in DYSF3 myoblasts expressing dysferlin constructs. Distribution of annexin A2 was analyzed by immunofluorescence using an anti-annexin A2 antibody and Cy2-conjugated anti-rabbit secondary antibody in C25 and DYSF3 myoblasts expressing full-length dysferlin-HA (FL-dysferlin-HA) (a,b) and mCherry (Cherry), or dysferlin N-terminal (N-term) or C-terminal (C-term) fused to mCherry (c,d). Experiments were performed in digitonin-permeabilized cells in the presence of 10 µM free Ca2+. Confocal images were captured at the equatorial plane of the cells using identical exposure settings between compared samples; therefore, annexin A2 distribution was measured in a single focal plane. (a,c) Annexin A2 stained (green) in C25 or DYSF3 myoblasts in a mock condition or expressing FL-dysferlin-HA (a) and N-term or C-term (c). Scale bar = 20 µm. Insets show digital magnification of the boxed areas. (b,d) Data show means ± SEM of the ratio of the mean fluorescence intensity of the cytosol/whole cell of annexin A2 immunostaining. The number of analyzed cells from four different cultures is indicated in parentheses. * p < 0.05 (t-test).

