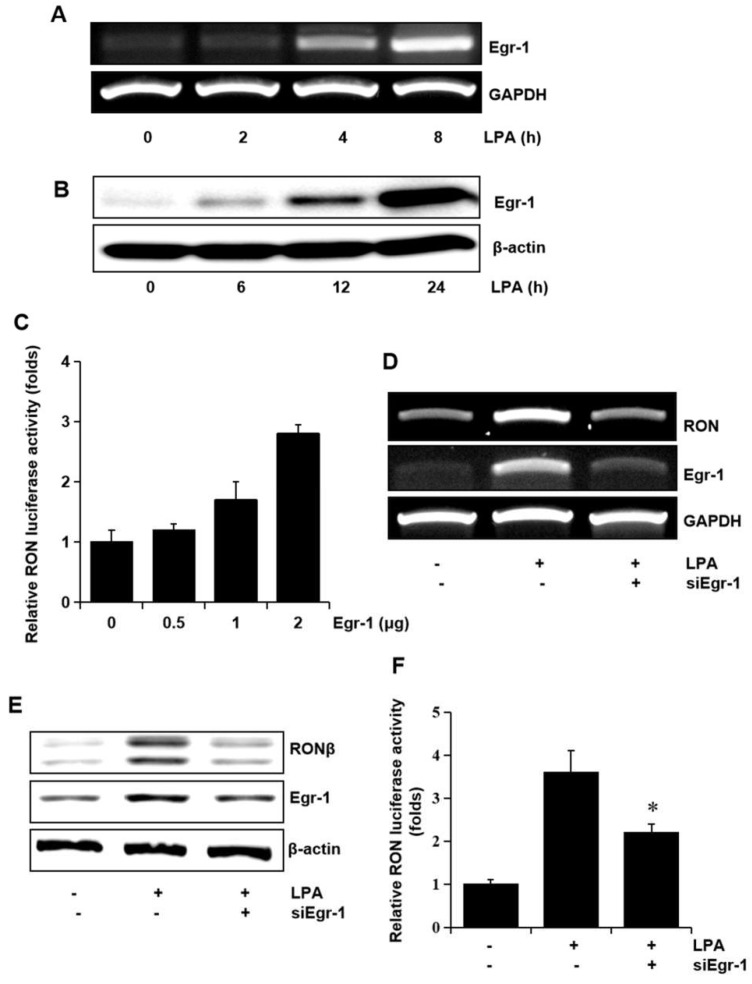
Figure 5.
Involvement of the transcription factor Egr-1 in LPA induced RON expression. (A,B) T24 cells were incubated with 5 μM LPA for indicated durations, and Egr-1 mRNA and protein expression were determined by RT-PCR and Western blot analysis, respectively. (C) T24 cells transfected with Egr-1 expression plasmids (0–2 μg) for 48 h were transiently co-transfected with a RON promoter reporter overnight, and luciferase activity was then measured using a luminometer. Bars show the mean standard deviation from three measurements. (D,E) T24 cells transfected with Egr-1 siRNA oligonucleotides for 48 h were treated with 5 μM LPA for the indicated durations, and RON mRNA and protein expression were determined by RT-PCR and Western blot analysis, respectively. (F) T24 cells transfected with Egr-1 siRNA oligonucleotides for 48 h were co-transfected with a RON promoter reporter overnight. After incubation with 5 μM LPA for 8 h, luciferase activity was measured with a luminometer. Bars show the mean standard deviation from three measurements. * p < 0.05 vs. LPA only.

