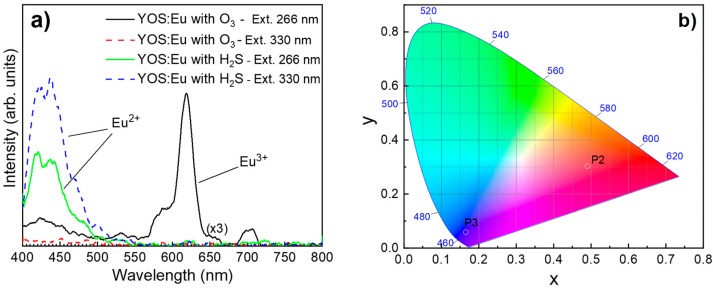
Figure 5.
(a) Photoluminescence spectra measured from Y2O3−xSx:Eu samples prepared using either process P2 or P3. The measurements were carried out at room temperature. Excitation wavelengths of 266 and 330 nm were used. (b) CIE 1931 chromaticity diagram for Y2O3−xSx:Eu samples deduced from photoluminescence measurements in (a).

