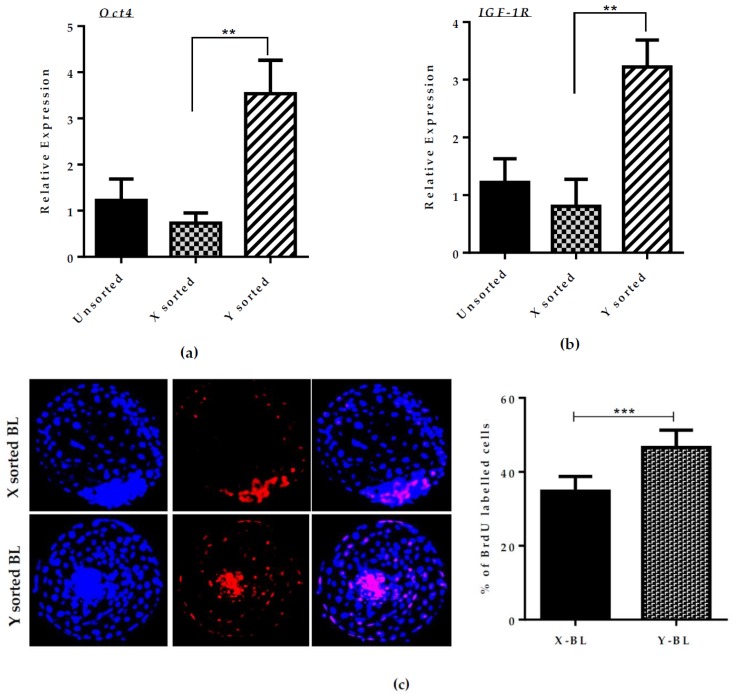
Figure 1.
Differences in developmental competence and cell proliferation ratio during X- and Y-BL (blastocyst) development. Relative mRNA expression of (a) OCT4 and (b) IGF1-R in unsorted, X-sorted, and Y sperm-sorted day seven BLs. (c) Immunofluorescence staining of 5-bromo-2′-deoxyuridine (BrdU) in X and Y sperm-derived day seven BL. Quantification of cell proliferation rate. Bar graph data represent means ± SEM (standard error of mean) from three independent sets of experiment, including n = 20 BLs per group in each replicate. ** p < 0.01; *** p < 0.001 indicates significant difference. Original magnification 100×.

