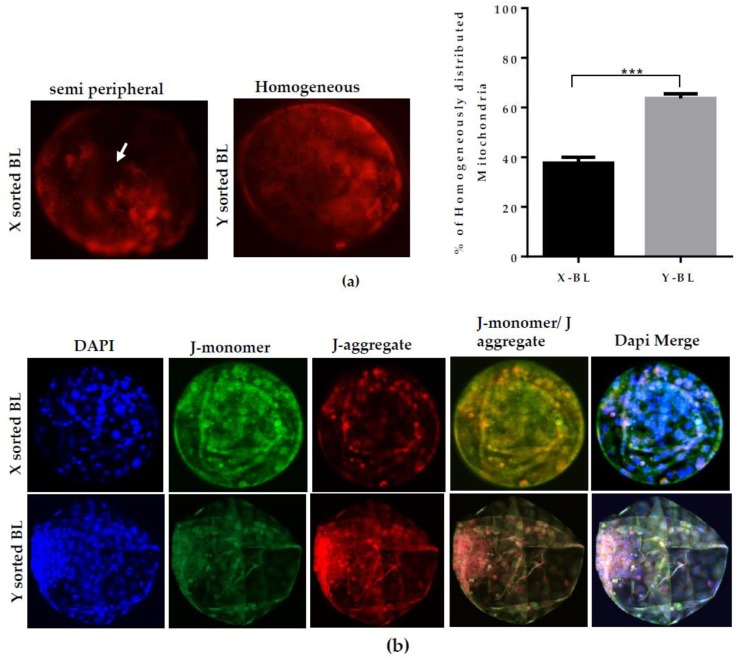
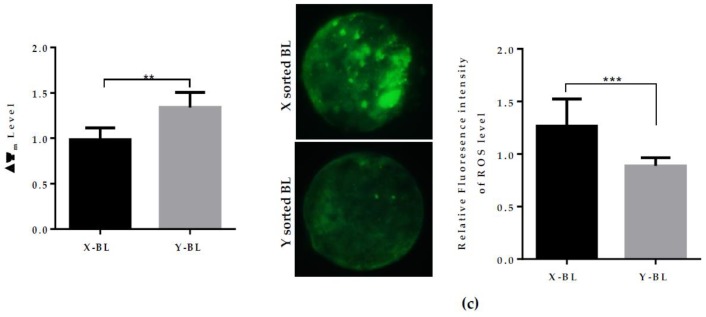
Figure 2.
Difference in mitochondrial distribution, ∆Ѱm, and ROS level during the development of X- and Y-sorted BLs. (a) Representative images of Mitotracker (Red) staining showing X-BL with semiperipheral and Y-BL with homogeneous distribution patterns of mitochondria. Data in graph represent the percentage of homogeneously distributed mitochondria in the X- and Y-BL groups. (b) Expression of J-monomer (green) and J-aggregates (red) was analyzed by JC-1 staining to measure the mitochondrial ∆Ѱm in X- and Y-BL using confocal microscopy. Quantification for relative fluorescence intensities in both X- and Y sperm-derived BLs are presented in graph. (c) DCHDFA (2’, 7’-dichlorodihydrofluorescein diacetate) staining for the generation of ROS level in X- and Y-BL. Quantification of fluorescence intensities is shown in graph. Bar graphs represent means ± SEM from three separate experiments with day seven BLs, n = 15 per group in individual sets of assays. ** p < 0.01; *** p < 0.001. Original Magnification 100×.


