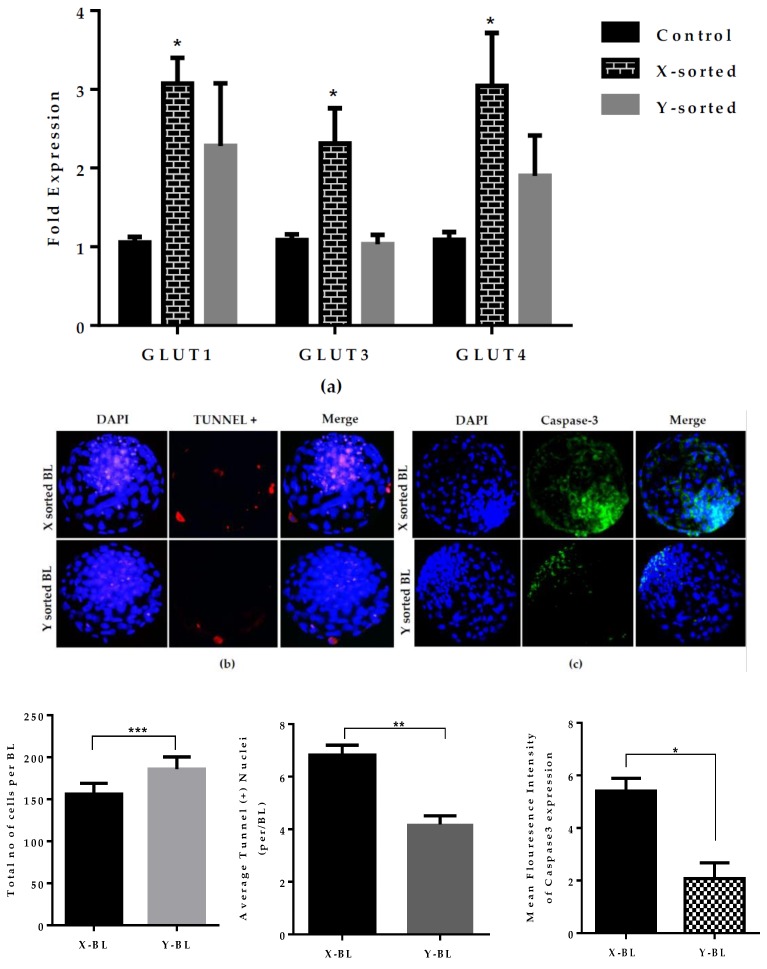
Figure 4.
Differences in cell metabolism and apoptosis level on the quality and development kinetics of X- and Y-sorted BL. (a) Relative mRNA level of GLUT1, GLUT3, GLUT4 in control, X-, and Y-sperm generated day seven BL groups. (b) Fluorescence microscope image of TUNEL-positive cells (red) and DAPI (4,6-diamidino-2-phenylindole) (blue) shown in X- and Y-BL at day seven. White arrows indicate the apoptotic cells in nuclei. (c) Representative fluorescent image showing Caspase-3 expression in X- and Y-BL. Graphical data represent the quantification of fluorescent images of X- and Y-BL groups. Data in the bar graphs represent the means ± SEM from three independent sets of experiments including n = 20 BLs per group in each replicate. * p < 0.05; ** p < 0.01; *** p < 0.001. Original magnification 100×.

