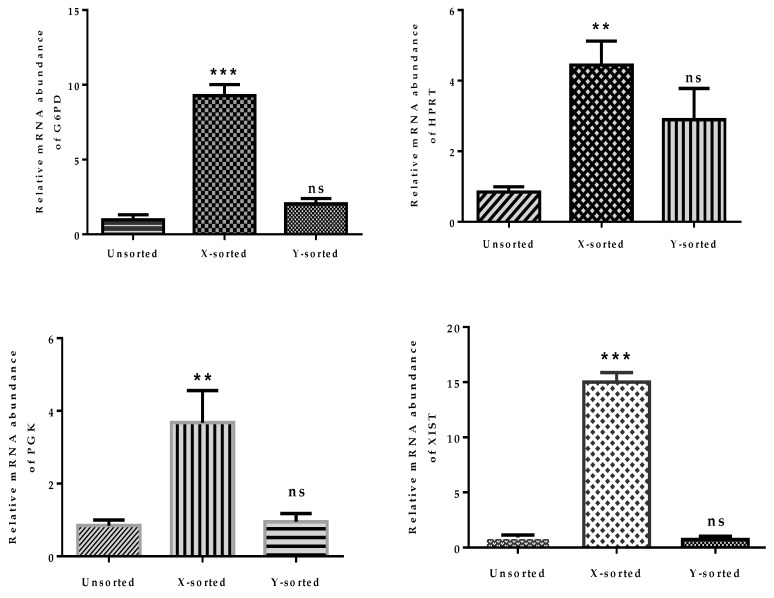
Figure 5.
Relative mRNA expression of X-chromosome linked genes in X and Y sperm-sorted BLs. Quantitative real-time PCR analysis showing the mRNA expression level of X-chromosome linked genes, G6PD, HPRT, PGK, and XIST in an unsorted, X, and Y sperm-sorted BL. Data in the bar graphs represent the means ± SEM from three independent sets of experiments. ** p < 0.01; *** p < 0.001. ns indicated the non-significant difference as compared to unsorted group.

