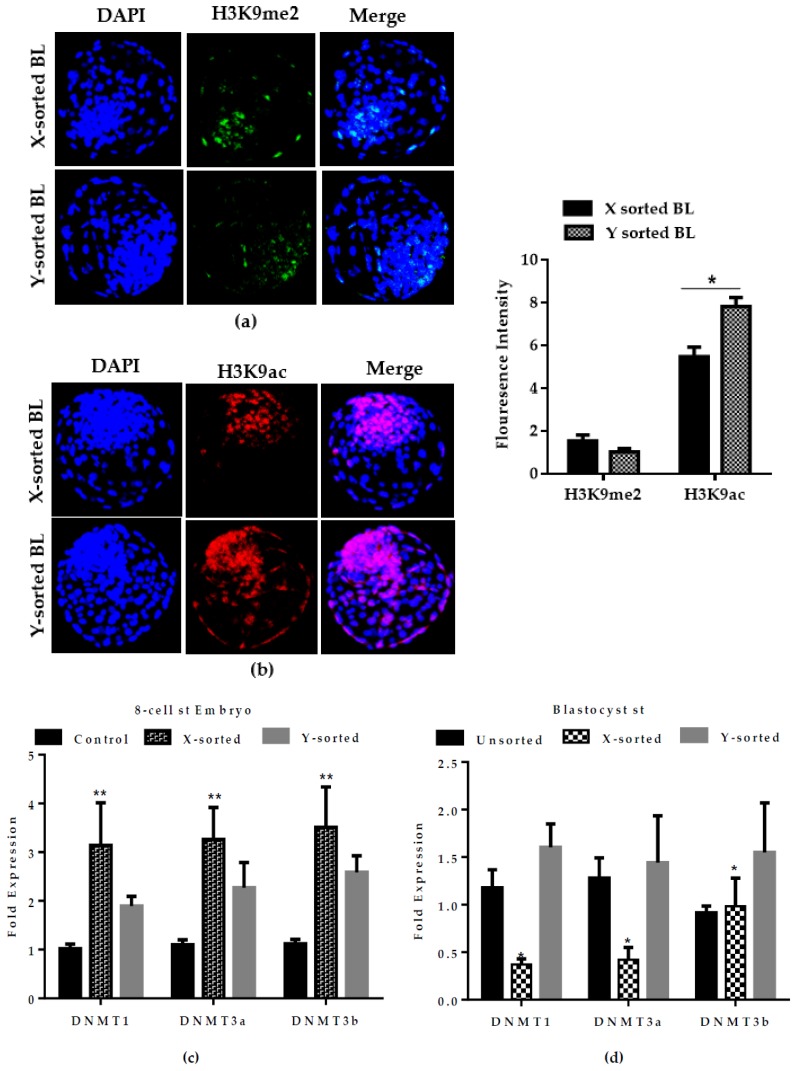
Figure 6.
Epigenetic status during development of X and Y sperm-sorted BL. (a) Representative fluorescent images of H3K9me2 and (b) H3K9ac in X- and Y-BL. Mean fluorescence intensity of H3K9me2 and H3K9ac signals in the X- and Y-BL groups are presented in the graph. The experiment was performed in triplicate sets of experiment with 20 BLs per group in each replicate (c,d). Analysis of relative mRNA expression of DNMTs in X and Y sperm-sorted 8-cell stage embryo and day eight BLs. Data in the bar graphs represent the means ± SEM from three independent sets of experiments. * p < 0.05; ** p < 0.01. Original magnification 100×.

