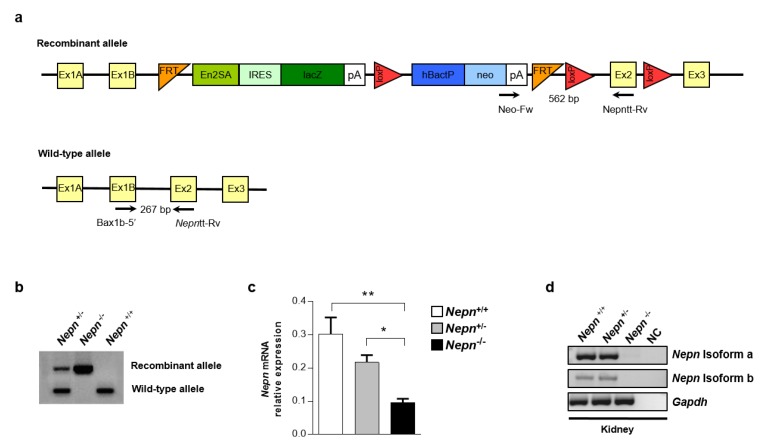
Figure 3.
Generation of a mouse model for Nepn gene depletion. (a) Graphical representation of Nepn mutated locus in mESCs used to generate Nepn KO first mouse Primer designing for RT-PCR are indicated as arrows in the picture. (b) PCR analysis of genomic DNA isolated from mouse ear. The upper band in the panel displays the Nepn recombinant allele, while the lower band displays Nepn wild-type allele. Thus, the appearance of the upper band alone displays mutated homozygous allele; the lower band alone represents wild-type Nepn allele; while both bands together mean that the mouse is Nepn heterozygous. (c) RT-qPCR was performed to quantify the minimal expression of Nepn in Nepn−/− mouse and relative controls. The data reported are normalized on Gapdh expression. Three replicates for each experimental point were performed. Error bars represent the standard deviation of normalized values (* p < 0.05, ** p < 0.001). (d) Nepn isoforms a and b expression in Nepn−/− mouse kidney and relative controls. Full blot is showed in Supplementary Information.

