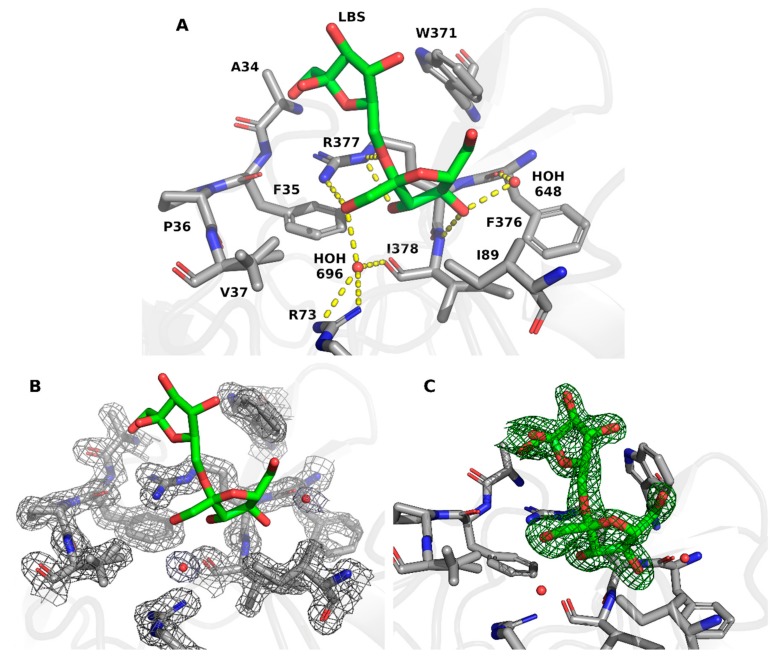
Figure 2.
LBS binding pocket. (A) LBS interaction with EtLSC (PDB ID: 6RV5). Note: ligand molecule shown as green stick. (B) Representation of 2Fobs−Fcalc electron density map of the LBS binding site. Note: electron-density map contoured at 1.5 σ. (C) Representation of polder map (omit map that excludes bulk solvent around omitted region) calculated with exclusion of LBS molecule. Note: polder map contoured at 4 σ.

