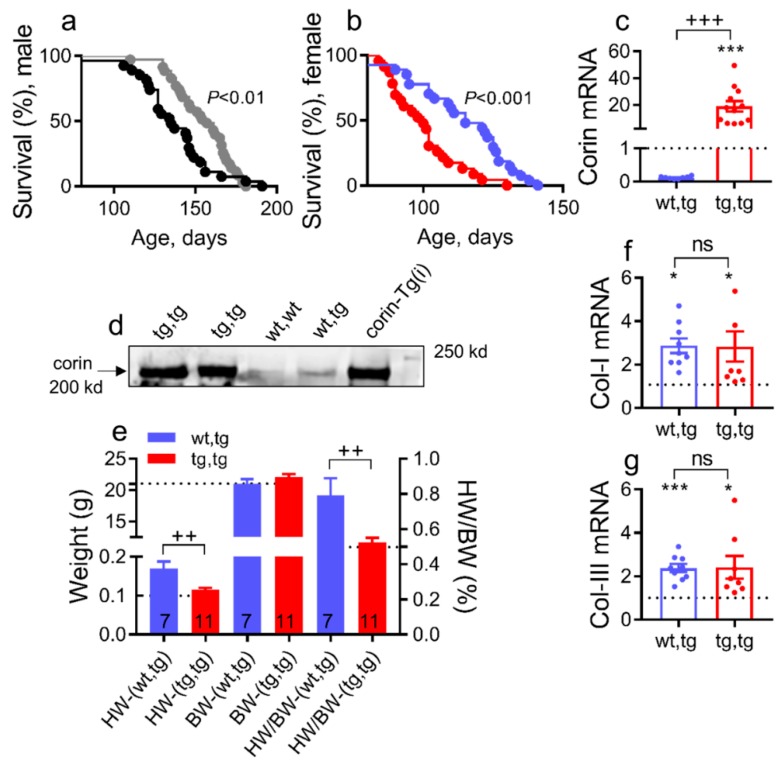
Figure 2.
Corin-Tg(i) cardiac overexpression increases survival, reduces heart weights, and does not modulate collagen-I and III cardiac expression in mice with DCM. (a,b) Kaplan–Meier survival curves of male mice (a) with genotype tg,tg (●, n = 34) or wt,tg (●, n = 27), and female mice (b) with genotype tg,tg (●, n = 34) or wt,tg (●, n = 33). Corin-Tg(i)/DCM= tg,tg and corin-WT/DCM= wt,tg. (c) Cardiac expression of corin-Tg(i) transcripts in tg,tg vs. wt,tg mice at 90 days determined by qRT-PCR (n = 8–12 per group). (d) Corin cardiac protein expression assessed by Western blot under reduced conditions in tg,tg, wt,tg, wt,wt, and corin-Tg(i) female mice groups, 49 days old mice, 50 µg protein per lane [26,39]. (e) Comparison of heart weight (HW), body weight (BW) (left Y-axis), and heart weight to body weight ratio (HW/BW) (right y-axis) in tg,tg vs. wt,tg female mouse groups, at 90 days of age; the number of animals per group is shown. (f) Cardiac expression of collagen-I (Col-I) transcripts and (g) collagen-III (Col-III) transcripts levels in female tg,tg vs. wt,tg mouse groups (n = 8–9 per group). Statistical differences for (c,f) were analyzed by one-way ANOVA using Newman–Keuls multiple comparison test, and for (g) by using Kruskal–Wallis test using Dunn’s multiple comparison test. Differences between two groups (e) were analyzed by Student’s t test. Dotted lines represent WT levels as a reference. Data are represented as mean ± SE; *** p < 0.001, * p < 0.05 (tg,tg or wt,tg vs. WT); +++ p < 0.001, ++ p < 0.01 (tg,tg vs. wt,tg); ns = not significant.

