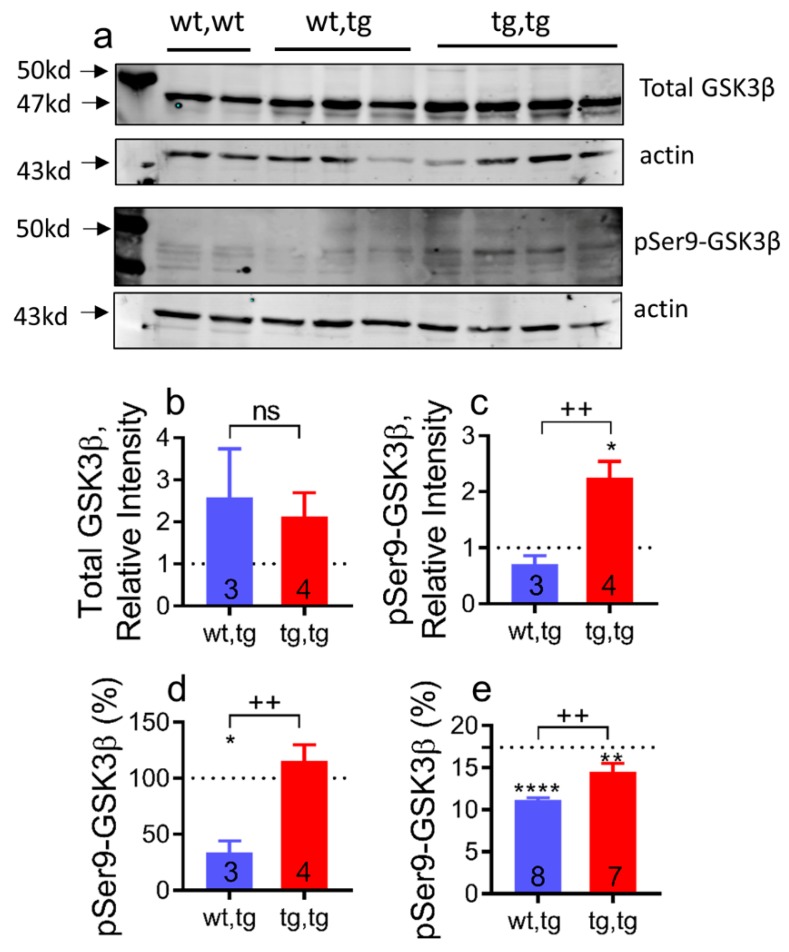
Figure 7.
Corin-Tg(i) overexpression modulates pSer9-GSK3β levels in female DCM mice. (a) Western blot analysis of cytosol fraction of heart tissue extracts, with antibodies directed against total GSK3β and pSer9-GSK3β under reducing conditions; each lane represents an individual mouse sample. Row 1: Total GSK3β levels (47 kD). Row 2: Actin (43 kD) as loading control for total GSK3β. Row 3: pSer9-GSK3β levels (47 kD) in same set of mice. Row 4: Actin (43 kD) as loading control for pSer9-GSK3β. (b–d) Bar graphs represent the densitometry analysis of data presented on panel (a) by using Image J software: (b) Total GSK3βlevels, (c) pSer9-GSK3β levels in corin-WT/DCM (wt,tg) and corin-Tg(i)/DCM (tg,tg) groups as a ratio to corin-WT/WT (wt,wt levels), normalized to corresponding actin levels and represented as relative intensity. (d) pSer9-GSK3β (%) levels represented as a ratio to total GSK3β levels; (e) ELISA analysis of cytosol fraction of heart tissue extracts, with antibodies directed against total GSK3β and pSer9-GSK3β. pSer9-GSK3β (%) levels represented as a ratio to total GSK3β levels. Dotted line represents corin-WT/WT (wt,wt; n = 7) mice. The number of mice per group is shown. Differences were analyzed by one-way-ANOVA using Newman–Keuls multiple comparison test. Data are represented as mean ± SE; **** p < 0.0001, ** p < 0.01, * p < 0.05 (tg,tg or wt,tg vs. wt,wt); ++ p < 0.01 (tg,tg vs. wt,tg); ns = non-significant.

