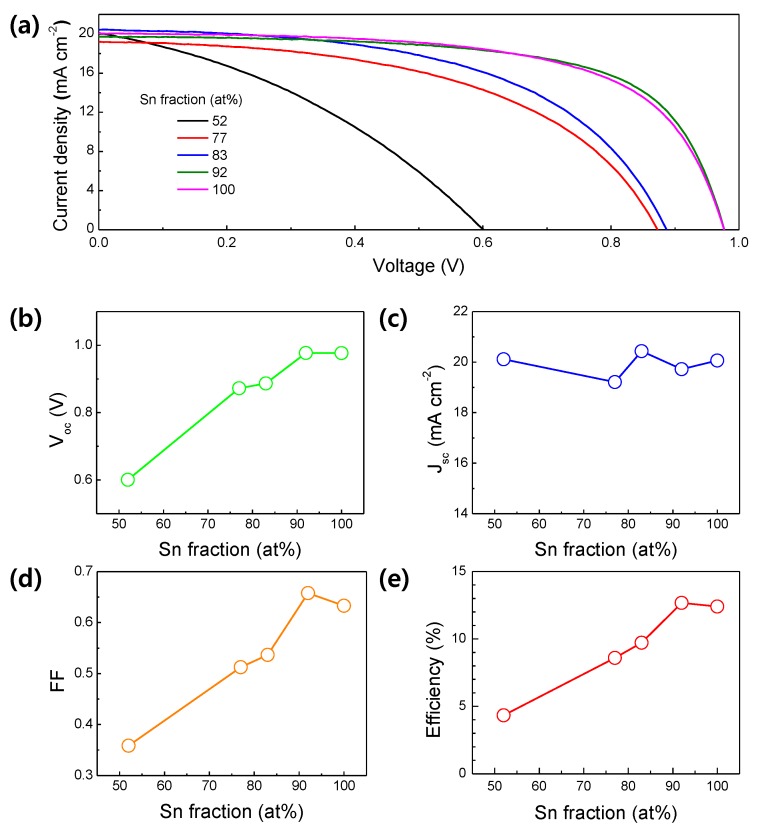
Figure 4.
(a) J-V curves of the TIO-ETL-based PSCs with different Sn fractions. The curves were collected under the following conditions: solar simulated light of AM 1.5G, 100 mV cm−2, scan rate (reverse) of 100 mV s−1, active area of 0.1 cm2. The photovoltaic parameters extracted from the curves; (b) Voc, (c) Jsc, (d) FF, and (e) PCE.

