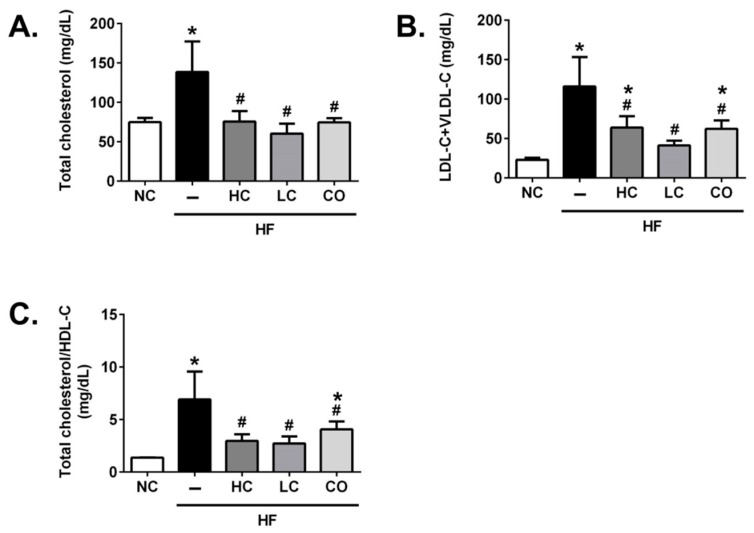
Figure 2.
Effects of high-molecular weight and low-molecular weight (MW) chitosan or chitosan oligosaccharide on levels of total cholesterol (A), low-density lipoprotein cholesterol (LDL-C), very-low-density lipoprotein cholesterol (VLDL-C) (B), and the ratio of total cholesterol and high-density lipoprotein cholesterol (HDL-C) (C) in the plasma of high-fat (HF) diet-fed rats. The rats were fed with different experimental diets for 8 weeks. Data are presented as the mean ± SD (n = 6). * p < 0.05 as compared with the control group; # p < 0.05 as compared with the HF group. NC, normal control +5% cellulose; HF, high-fat diet +5% cellulose; HC, high-fat diet +5% high-MW chitosan; LC, high-fat diet +5% low-MW chitosan; CO, high-fat diet +5% chitosan oligosaccharide.

