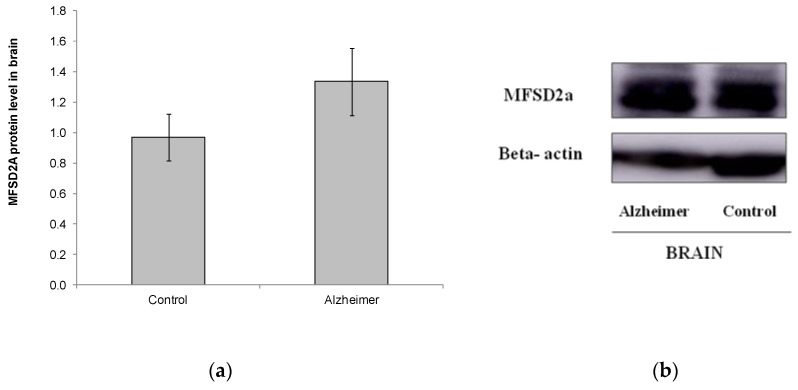
Figure 3.
(a) Relative protein level of MFSD2a in the brain of controls and AD patients (p = 0.183). Results are expressed as mean ± SEM. A Student’s t-test was used to assess differences among the groups. (b) Example of Western blot analysis of MFSD2a and GADPH expression in postmortem brain tissue from control and GDS6 of AD patients. Significant differences are indicated by footnote symbols: * Result indicates a significant difference compared to the Control group (p < 0.05); † Result would indicate significant differences compared to the GDS4 group (p < 0.05).

