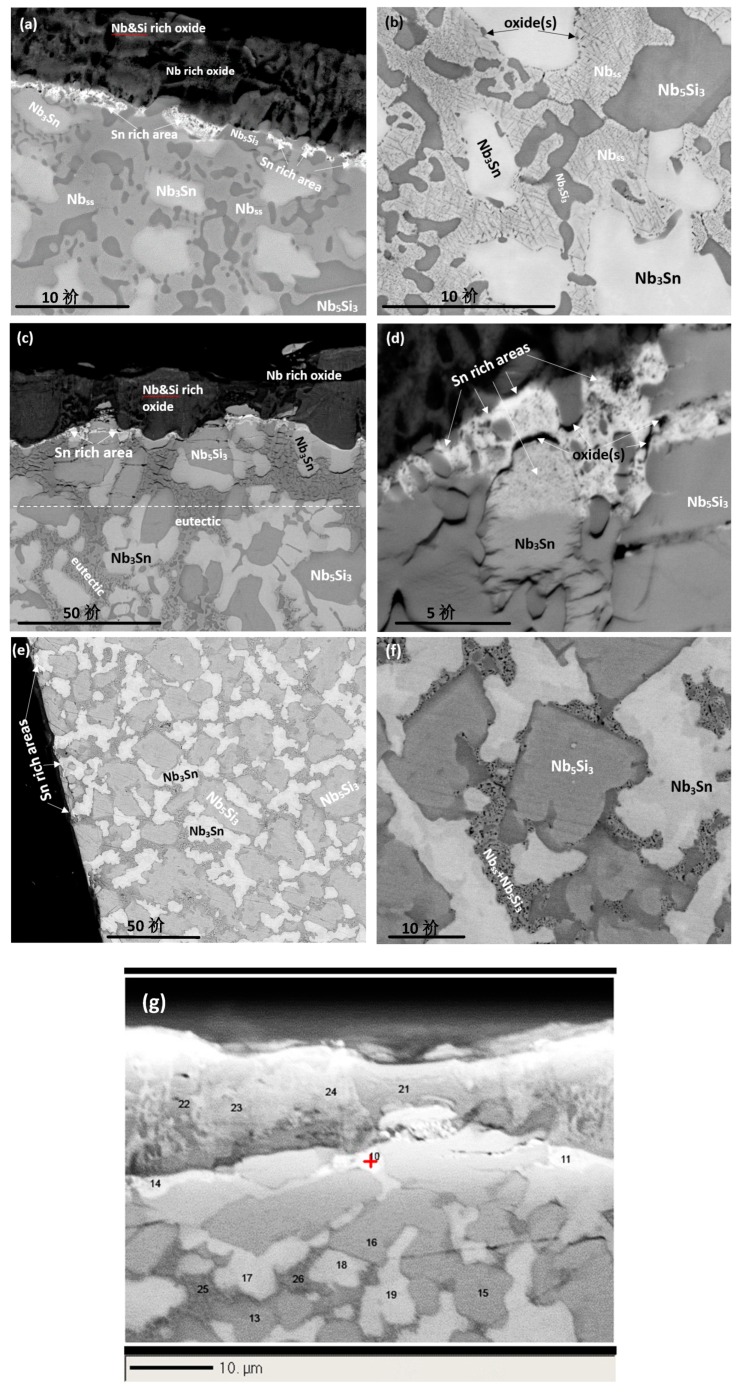
Figure 7.
BSE images of cross sections of the oxidised specimens of the alloys ZX4 (a,b), ZX6 (c,d) and ZX8 (e,f) at 800 °C. The numbers in (g) indicate the “spots” of WDS analyses in the Sn rich area and near it (see Table 5). The dashed line in (c) indicates the depth of the diffusion zone.

