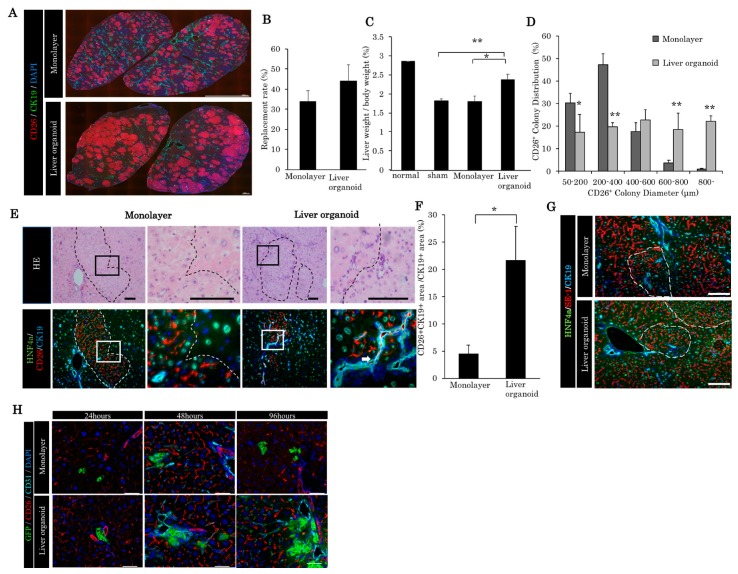
Figure 2.
Comparison of liver regeneration and bile duct reconstruction between monolayer cells and liver organoids in the chronic liver damaged by retrorsine/partial hepatectomy (RS/PH). (A) Repopulation of transplanted cells in the retrorsine/partial hepatectomy (RS/PH) models. A total of 3.0 × 10³ liver organoid monolayer cells, the equivalent of 3.0 × 10³ liver organoids, were transplanted. Thirty days after transplantation, quadrate lobes were immunohistochemically stained with CD26, CK19, and 4′,6-diamidino-2-phenylindole (DAPI). (B) Repopulation rate of the transplanted cell in the quadrate lobe of the RS/PH liver 30 days after transplantation. (C) Liver weight/body weight ratios of the normal liver and of those in the sham operation group, monolayer cell group, and liver organoid group 30 days after transplantation. * p < 0.05, ** p < 0.01 vs liver organoid group; one-way ANOVA with Bonferroni correction. (D) Distribution of CD26+ colony diameter. * p < 0.05, ** p < 0.01 vs monolayer group; Mann–Whitney U test, n = 3. (E) The donor-derived bile duct was anastomosed to the recipient bile duct. White arrows indicate the anastomosis. In the monolayer cell transplanted group, the donor-derived bile ducts could not be observed. Scale bars: 100 μm. (F) The ratio of the CD26+/CK19+ area to the CK19+ area showing the donor-derived bile duct area. * p < 0.05 vs monolayer, Mann–Whitney U test, n = 3. (G) The liver sinusoidal endothelial cells were observed both in the donor area and recipient area. SE-1: liver sinusoidal endothelial cell marker. Scale bars: 100 μm. (H) Twenty-four, 48, and 96 h after transplantation of enhanced green fluorescent protein (EGFP)-positive fetal rat-derived liver organoids and monolayer cultured cells. Note that liver organoids can spread faster than monolayer cells from the periphery of the portal branches without portal vein thrombus. Scale: 100 μm.

