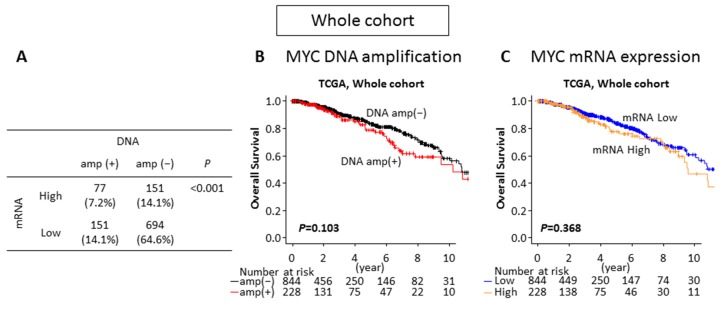
Figure 2.
The impacts of MYC DNA amplification and mRNA expression on patient survival in TCGA whole breast cancer cohort. (A) Patients proportion of each group by MYC DNA amplification and mRNA expression. (B) Overall survival comparing the MYC DNA non-amplified (DNA amp(−) in black) and amplified (DNA amp(+) in red) tumors. (C) Overall survival comparing the MYC mRNA low (mRNA low in blue) and high (mRNA high in orange) expressing tumors.

