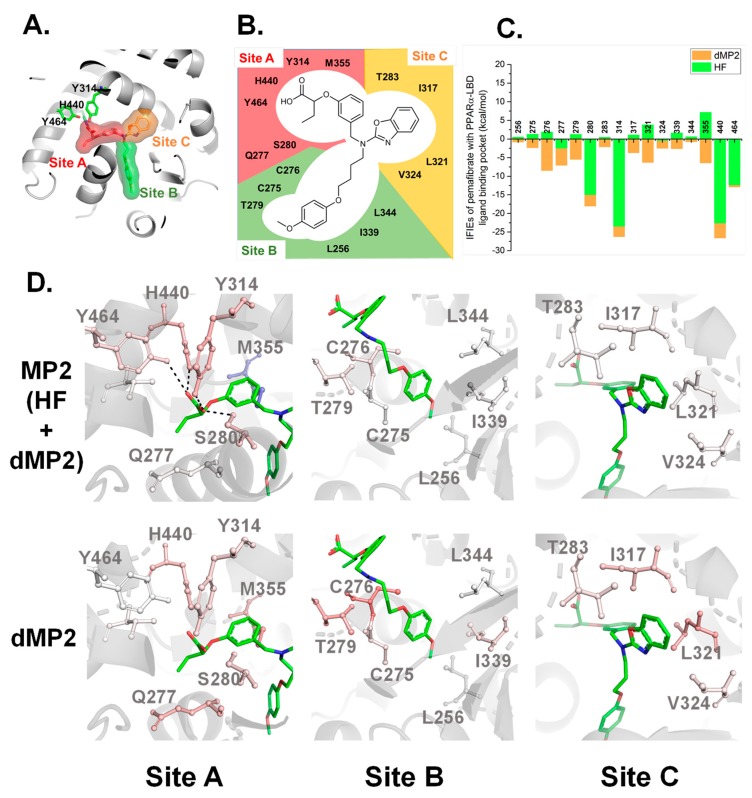
Figure 3.
(A) Division of the LBP site of PPARα into three sites. The LBP is divided into three sites: site A (red surface), site B (green surface), and site C (orange surface). (B) Potential interacting residues at the LBP of PPARα with pemafibrate. A total of 16 residues were located within 3.2 Å distance from pemafibrate. (C) Significant interfragment interaction energies (IFIEs) between pemafibrate and LBP residues of PPARα. The HF-IFIEs and dMP2-IFIEs represented in green and orange, respectively. (D) Representation of MP2-IFIEs (upper row) and dMP2-IFIEs (bottom row) at the three sites on the crystal structure of the PPARα-LBD/pemafibrate/SRC1 peptide. The structures are colored depending on the magnitude of the IFIEs value. Positive (repulsive) and negative (attractive) IFIEs are colored by blue and red, respectively.

