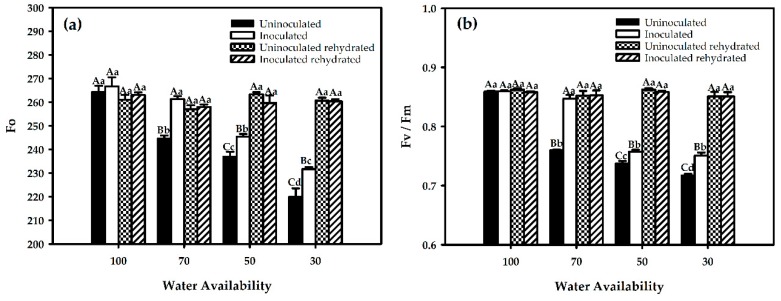
Figure 3.
Initial fluorescence (a) and FSII maximum quantum yield (b) in red rice under different water restriction and inoculation conditions. Averages followed by identical capital letters do not differ in the inoculation condition for each soil water treatment, and averages followed by identical lowercase letters do not differ in the percentage of soil water. Bars represent the standard error (n = 3).

