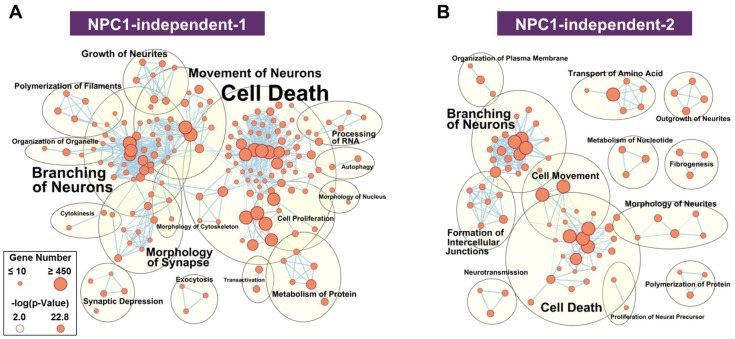
Figure 5.
Functional enrichment for NPC1-independent-1 and 2 modules. IPA functional analysis of the significantly enriched molecular and cellular functions for the NPC1-independent-1 (A) and NPC1-independent-2 (B) modules. Each node represents a specific molecular and cellular function, the size of which corresponds to the number of genes included in each function. The edges represent the number of shared genes between each function. Expression data is from 4.5 weeks old Npc1 control and mutant mice.

