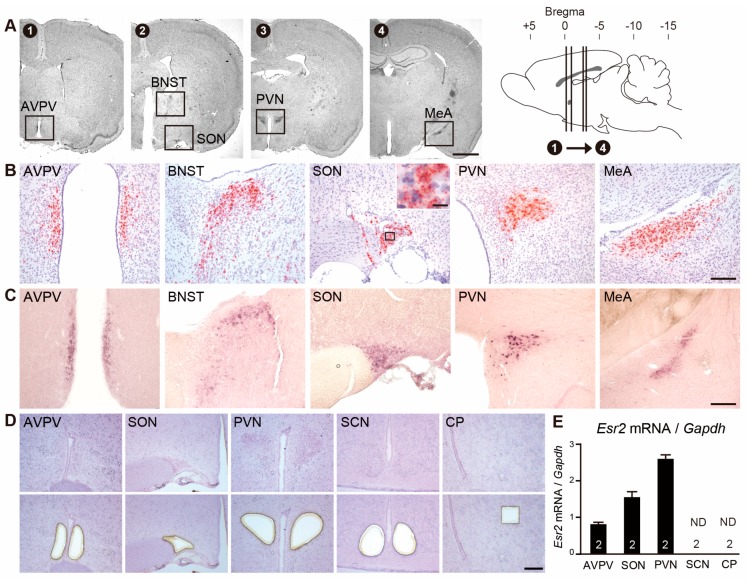
Figure 1.
Comparison of Esr2 signals by RNAscope with Esr2 signals by conventional in situ hybridization (ISH) and expression levels of Esr2 mRNA by qPCR. (A) Nissl-stained images (1–4) and schematic sagittal brain section demonstrate the rostro-caudal levels of the rat brain. Insets in the Nissl-stained images show anatomical loci of the AVPV, BNST, SON, PVN, and MeA. Representative photomicrographs of Esr2 mRNA signals by RNAscope (B) and by conventional ISH (C) in the AVPV, BNST, SON, PVN, and MeA. (D) Representative photographs exhibiting brain sections before (upper panels) and after (lower panels) isolation by laser-microdissection. Scale bars indicate 2 mm in all panels in A, and 200 µm in all panels in B, C, and D. Inset in the SON panel in B shows higher magnification of cells containing Esr2 signals (scale bar = 20 µm). (E) Quantification of the Esr2 mRNA in the micro-dissected samples by qPCR. Numbers in each column represent the number of animals used. Values are depicted as the mean ± standard error of the mean (SEM). ND indicates “not-detected”. AVPV: anteroventral periventricular nucleus; BNST: bed nucleus stria terminalis; SON: supraoptic nucleus; PVN: paraventricular nucleus of the hypothalamus; MeA: medial amygdala; SCN: suprachiasmatic nucleus; CP: corpus striatum.

